
Every so often I get notes in my email from folks that have “skin in the game.” I received an email from Jim Schutze, a self-described “investigative columnist” who was annoyed by a report that I wrote for the Foundation for Community Empowerment (FCE).
A columnist is someone who writes for publication in a series, creating an article that usually offers commentary and opinions…a specific writer who offers a personal point of view.
So apparently an “investigative columnist” is someone who investigates to offer a personal point of view.
I was asked by FCE to consult and develop an independent assessment of the tenure of Dallas Independent School District Superintendent Mike Miles to this point. They wanted an academic perspective and new evidence injected into the discussion.
I have posted several excerpts from the FCE report over the past week or so.
How much have I written about Supt. Mike Miles until I was asked consult on an independent review? 0. Nada. Nothing. What we did find was quite to surprising to be honest. (If you read to the end you will find how many columns Jim Schutze has written (or been mentioned) in support of Mike Miles. Please don’t cheat and look at the title of this post or the lead photo)
The first post from the Miles report described the context of reform and was drawn from the first section. It was entitled Taylor v. Dewey: The 100-year Trickle-Down vs. Pedagogical Debate/Fight in Education Reform

Here is what Diane Ravitch, an education historian and professor, said about the first post from the Miles report:
Julian Vasquez Heilig is the most creative blogger I know in terms of his brilliant combination of flashy graphics, research, and informed commentary.
Here he describes the century-long battle between the managerial elites—who believe that schools can be improved by data, management, mandates and standardization, always controlled by them–and the pedagogical crowd–who have fought the managers that the starting point in education is the students, how they learn, what they need, not the management.
It is Taylor vs. Dewey.
The Taylorites run the show for now. They ARE the status quo.
The day of reckoning is coming.
They are losing because everything they have done has failed.
The second excerpt from the Foundation for Community Empowerment report examined Broadies and the Broad Foundation— Mike Miles bread and butter. In the post Who Should You Hire?: Contrasted Superintendency Leadership— Trickle-Down vs. Pedagogical. In that post derived from the Miles report I asked:
What type of superintendent should your community hire? A Pedagogical leader/reformer or an Administrative leader/reformer?
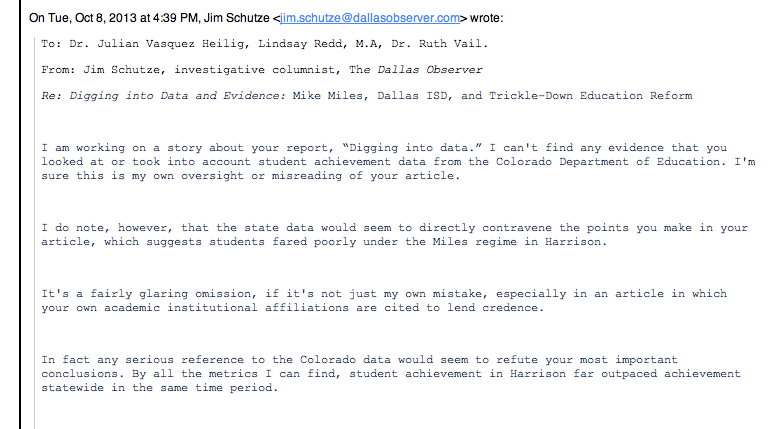
So back to the investigative opinion writer/columnist. Jim Schutze’s email:
I am working on a story [I actually mean opinion column] about your report, “Digging into data.” I can’t find any evidence that you looked at or took into account student achievement data from the Colorado Department of Education…
I do note, however, that the state data would seem to directly contravene the points you make in your article, which suggests students fared poorly under the Miles regime in Harrison.
It’s a fairly glaring omission… especially in an article in which your own academic institutional affiliations are cited to lend credence.
In fact any serious reference to the Colorado data would seem to refute your most important conclusions. By all the metrics I can find, student achievement in Harrison far outpaced achievement statewide in the same time period.
To be honest, I interact with lots of reporters (See Media here), but had never been contacted by an “investigative columnists.” So the tone of his email was quite surprising. But if you writing opinion rather than reporting, I guess that is a different animal altogether.

Jim Schutze’s charges:
- No examination of achievement data
- Besmirching reputation of your academic institution.
- Non-“serious” analysis of data
Does the report controvert Jim Schutze’s charges about controversion? I have posted below for your review the third section from the Foundation for Community Empowerment report— the data analysis:
While Mike Miles propensity to attract criticism relative to his trickle-down approach to school reform is not under debate, his track record for improving student success is. We will now analyze publicly available data to examine student outcomes in Harrison School District in Colorado. We will then conduct a school-level analysis of STAAR scores in Dallas ISD.
Harrison School District
There are several disconcerting data trends in the years spanning Mr. Miles’ time in Harrison, specifically the rates of attrition at the secondary level. At the aggregate, over time, the numbers do not appear to be problematic, as Harrison enrolled 11,165 students district wide in 2006-2007, and had enrolled 11,203 at the end of tenure(See Appendix 1). However, this small net of 48 students is due to enrollment increases in the primary grades and masks the significant losses at the secondary level. For instance, the graduating class of 2006-2007, Mr. Miles’ first year as Superintendent, was 739. However, in 2011-2012 that number had fallen by 208 students to just 531— a drop of 28%. For comparison, during that same time period, Colorado Springs School District saw only a 13% drop (See Appendix 4).
Notably, though the 2006-2007 cohort exhibits a significant loss, it is possible that the attrition could be due to anomaly in a particular cohort. However, there was a steady rate of attrition year over year in Harrison. For example, looking at the seventh grade population during Miles’ first year in office, you will see that there were 794 students, and if you were to follow that cohort to graduation, Mr. Miles’ last year in office, you will see a negative change of 33%, or 263 students lost, in those 6 years. Similarly, the student cohort that was in 6th grade when Mr. Miles’ took over Harrison had a 39% attrition rate by junior year of high school (See Appendix 2). Again, comparing this to the same cohort trend in Colorado Springs, the 7th grade cohort of 2006-2007 had a 19% increase in enrollment by the time the class of 2012 was ready for graduation(See Appendix 4). The following cohort, 6th grade to 11th, saw a change of less than 1% over that same time period.
While traditional metrics of student progress remained virtually unchanged during Miles six-year tenure in Harrison— completion rates fell from 76.5% to 75.8% and dropout rates that remained at about 3%. However, it is clear from the attrition data that students were fleeing to neighboring districts. Also, although Miles touted bringing up the overall graduation rate from 61.5% to 74.1%, and that number fluctuated greatly throughout his 6 years, dipping below 65% twice, he did so while shedding a significant portion of Harrison’s secondary population.[1]
Turning to academic accountability within the Colorado state performance measures, in the sixth and final year of Miles’ leadership in Harrison, the district did not meet a single goal in the area of Elementary and High School Mathematics within the most vulnerable subgroups: Free and Reduced Price Lunch, Minority, English Language Learners (ELLs), Special Education, and Students “needing to catch up.” Though Harrison middle schools faired better, meeting four of the five mathematics measures, in writing only one of those five subgroups met the expected standards. Considering that Dallas ISD is comprised of similar students, the forthcoming analysis of school-level STAAR outcomes will illuminate whether in the same way trends of poor-performance occur amongst special populations.
The Harrison data complicate the positive spin that Mike Miles has framed about student success during his six years as superintendent in Harrison. There were certainly gains made after overall achievement indicators were observed in 2004-2005 and 2005-2006 in Harrison. However, in light of the troubling attrition rates and poor academic performance of students in mathematics and writing, those gains were not enough to bring the district back to the high levels of achievement seen in the pre-Miles era during the 2003-2004 school year, in which 82% of students graduated.[4]
Dallas ISD STAAR Analysis
The first year of implementation of Miles’ Destination 2020 plan has been a rocky one. Mike Miles himself explained that it was a tough year and that “even I could not anticipate some of the tough things that happened in Dallas.” Despite the turbulent year, Miles self reports his first year efforts as “proficient.” [5] Critics, however, continue to question Destination 2020. After the drastic restructuring of the central office that ended in unprecedented resignations, increased dismissal of principals with the new Principal Evaluation System, and a seemingly disproportionate negative focus on southern Dallas, critics have said otherwise. The full impact and success of Destination 2020 is yet to be seen, but the first year has certainly started in a troubling direction.
How have schools in Dallas ISD performed over the past year? To investigate this question we obtained 2012 and 2013 STAAR and End of Course (EOC) school-level data. Since there are only two years of assessment data available, we used paired t-tests to understand whether the change in means on the exams between years were statistically significant for the entire district. We are limited in the statistical tools that we have available to us due to the fact there are only two years of data available and that we do not have student-level data readily available.
Our statistical analysis utilizes STAAR and EOC scales scores for 3rd, 8th, and Math and English I Reading End of Course (EOC) to sample student performance across elementary, middle and high school levels in Dallas ISD. TEA relates,[6]
Scale scores can be interpreted across different sets of test questions. Scale scores allow direct comparisons of student performance between specific sets of test questions from different test administrations. A scale score is a conversion of the raw score onto a scale that is common to all test forms for that assessment. The scale score takes into account the difficulty level of the specific set of questions on which it is based. It quantifies a student’s performance relative to the passing standards or proficiency levels.
For elementary, the 3rd grade performance of Dallas ISD students show positive statistically significant results for all students in reading and negative results in mathematics between 2012 and 2013 (See Table 2). Latina/os and at-risk students show significant increases (a=.05) at the school level for both STAAR reading and math. Whites, African Americans and ELLs do not show statistically significant increases in reading or math performance in 3rd grade between 2012 and 2013 in Dallas ISD.
Table 2. Dallas ISD 3rd Grade STAAR Reading and Math: Paired Samples T-Test of Average Scale Scores (2011-2012 and 2012-2013)
|
Mean D |
Std. Deviation |
t |
df |
Sig. (2-tailed) |
|||
| Reading | All Students |
+7.853 |
41.249 |
2.277 |
142 |
.024 |
|
| Latina/o |
+14.717 |
46.810 |
3.543 |
126 |
.001 |
||
| African American |
-.023 |
49.902 |
.004 |
86 |
.997 |
||
| White |
+12.500 |
44.590 |
1.121 |
15 |
.280 |
||
| ELL |
+12.582 |
51.800 |
1.801 |
54 |
.077 |
||
| At-Risk |
+8.264 |
40.288 |
2.427 |
139 |
.016 |
||
| Math | All Students |
-9.161 |
43.590 |
2.513 |
142 |
.013 |
|
| Latina/o |
+9.309 |
47.942 |
2.264 |
135 |
.025 |
||
| African American |
+2.023 |
58.377 |
.321 |
85 |
.749 |
||
| White |
+30.688 |
62.339 |
1.969 |
15 |
.068 |
||
| ELL |
+7.832 |
52.507 |
1.707 |
130 |
.090 |
||
| At-Risk |
+7.881 |
44.028 |
2.141 |
142 |
.034 |
||
Overall, the 8th grade reading and mathematics STAAR results between 2012 and 2013 were quite promising for middle schools (See Table 3). For example, the 8th grade performance of Dallas ISD students show statistically significant increases for all student groups in mathematics. For reading, there were statistically significant results for all student groups except African Americans and Whites between 2012 and 2013.
Table 3. Dallas ISD 8th Grade STAAR Reading and Math: Paired Samples T-Test of Average Scale Scores (2011-2012 and 2012-2013)
|
Mean D |
Std. Deviation |
t |
df |
Sig. (2-tailed) |
|||
| Reading | All Students |
+15.000 |
20.780 |
-4.331 |
35 |
.000 |
|
| Latina/o |
+16.829 |
20.125 |
-4.947 |
34 |
.000 |
||
| African American |
+11.361 |
39.271 |
-1.736 |
35 |
.091 |
||
| White |
-9.727 |
39.256 |
.822 |
10 |
.430 |
||
| ELL |
+24.133 |
23.576 |
-5.607 |
29 |
.000 |
||
| At-Risk |
+18.636 |
33.363 |
-3.209 |
32 |
.003 |
||
| Math | All Students |
+23.394 |
20.910 |
-6.427 |
32 |
.000 |
|
| Latina/o |
+23.594 |
24.233 |
-5.508 |
31 |
.000 |
||
| African American |
+24.290 |
28.671 |
-4.717 |
30 |
.000 |
||
| White |
+32.714 |
29.062 |
-2.978 |
6 |
.025 |
||
| ELL |
+33.966 |
24.218 |
-7.552 |
28 |
.000 |
||
| At-Risk |
+25.375 |
17.814 |
-8.058 |
31 |
.000 |
||
The Dallas ISD EOC Algebra I and English I Reading results did not show statistically significant increases for high schools (See Table 4). Student performance did not exhibit any statistically significant increases for any student groups in English I Reading. For Algebra I, there were only statistically significant results for Whites between 2012 and 2013.
Table 4. Dallas ISD Algebra I and English I Reading End of Course: Paired Samples
T-Test of Average Scale Scores (2011-2012 and 2012-2013)
|
Mean D |
Std. Deviation |
t |
df |
Sig. (2-tailed) |
|||
| English I | All Students |
+25.694 |
81.926 |
-1.882 |
35 |
.068 |
|
| Reading | Latina/o |
+23.294 |
70.672 |
-1.922 |
33 |
.063 |
|
| African American |
+8.971 |
91.191 |
-.574 |
33 |
.570 |
||
| White |
+51.500 |
117.180 |
-1.522 |
11 |
.156 |
||
| ELL |
+5.520 |
47.919 |
-.576 |
24 |
.570 |
||
| At-Risk |
-4.828 |
39.987 |
.650 |
28 |
.521 |
||
| Algebra I | All Students |
+35.896 |
184.080 |
-1.596 |
66 |
.115 |
|
| Latina/o |
+45.833 |
204.140 |
-1.824 |
65 |
.073 |
||
| African American |
+6.691 |
158.858 |
-.312 |
54 |
.756 |
||
| White |
+148.438 |
203.135 |
-2.923 |
15 |
.010 |
||
| ELL |
-21.031 |
126.981 |
.937 |
31 |
.356 |
||
| At-Risk |
+21.308 |
128.773 |
-1.193 |
51 |
.238 |
||
In summary, the results under Miles’ tenure in Harrison and Dallas ISD are a mixed bag. The high-levels of attrition and the fact that Harrison missed the mark in the accountability system for its most vulnerable populations are red flags. In Dallas ISD, the modest improvement over one year (between 2012 and 2013) for Latina/os in 3rd grade is commendable. However, the performance for African Americans, ELL, and White students lagged. Also, there was a statistically significant decrease in Math scores for all students in 3rd grade. The 8th grade STAAR data is significant and positive across student groups for math and reading. The EOC test score data did not show statistically significant improvements during Miles tenure.
How do I sum up Mike Miles tenure in Dallas? In a Dallas Morning News editorial I wrote:
In summary, based on our findings in the report, what grades would I give Miles for the past year based on our STAAR and EOC score statistical analysis?
Elementary: C
Middle: B
High School: F
In conclusion, Jim Schutze’s charges=

I have noted that if you go to the Dallas Observer website you can do a quick search for Schutze and Miles and find that there has been 286 columns written in support of Mike Miles by or mentioning Jim Schutze. Our Harrison data was a counternarrative to the 286 columns written with/including/about/by Schutze. The Harrison attrition and accountability results for vulnerable subgroups are public record. We didn’t think t-tests of Harrison data was primary in the discussion (or appropriate because there is more than two years of data) which is why as external evaluators we used the t-test and focused instead on school-level Dallas ISD data (2012-2013).
286. Speaking of bias, non-serious and/or besmirching… 🙂 286.
Please Facebook Like, Tweet, etc below and/or reblog to share this discussion with others.
Want to know about Cloaking Inequity’s freshly pressed conversations about educational policy? Click the “Follow blog by email” button in the upper left hand corner of this page.
Twitter: @ProfessorJVH
Click here for Vitae.
Please blame Siri for any typos.
p.s. Jim, Thanks for the email. I had no idea how I was going to make these stats interesting.
Update 10/17/13: Jim Schutze wrote that in this blog post I included an “attributing a stupid-sounding quote to me, in quotation marks, that Heilig made up out of thin air.” Of course the information in the bracket was my own. But the rest of the quote was his. Here is a screenshot of his email:
“Stupid is as stupid does.” Forrest Gump
[1] https://www.hsd2.org/sites/www.hsd2.org/files/u99/district_performance.pdf
[2] Ibid.
[3] Ibid.


Leave a comment