Teach For America: A Return to the Evidence (The Sequel)

The sequel to the 2010 Teach For America: A Review of the Evidence was released by the National Education Policy Center (NEPC) today. The new policy report is entitled Teach For America: A Return to the Evidence. I have included the citation, official NEPC press release, and the Executive Summary in this post.

Citation: Vasquez Heilig, J. & Jez, S.J. (2014). Teach For America: A Return to the Evidence. Boulder, CO: National Education Policy Center. Retrieved from http://nepc.colorado.edu/publication/teach-for-america-return.

Press Release: A Return to the Evidence

Scholars conclude the program has some strengths, but smart policy should focus on reforms
that create stability and with stronger track records for improving student achievement

BOULDER, CO (January 7, 2014) — Teach For America (TFA) is almost a quarter-century old. Since its launch, the program has experienced phenomenal growth, both in the numbers of participants and in the financial support it has received, and it has enjoyed extensive favorable publicity.

Teach For America: A Return to the Evidence, a report authored by professors Julian Vasquez Heilig of the University of Texas and Su Jin Jez of California State University, Sacramento for the National Education Policy Center, challenges the simplistic but widespread belief that TFA is a clear-cut success story. In fact, Heilig and Jez find that the best evidence shows TFA participants as a group are not meaningfully or consistently improving educational outcomes for the children they have taught.

Teach For America recruits college graduates, typically from elite universities, to serve in short-term (two-year) positions teaching in low-income communities. According to Heilig and Jez, the program is a mixed bag, with some benefits and some harms. But, they conclude, it is hugely oversold and it risks being a distraction from alternative strategies for which research evidence provides much stronger support for improving teaching and educational outcomes, especially for children living in poverty.

Teach For America and other organizations have produced studies asserting benefits provided by TFA teachers. Those studies, however, have only rarely undergone peer review – the standard benchmark for quality research, Heilig and Jez observe. In contrast, the available peer reviewed research has produced a decidedly mixed picture. For example, the results attributed to TFA teachers varies both by their experience and certification level. The results also fluctuate depending on the types of teachers to whom the TFA teachers are compared; TFA teachers look relatively good when compared to other inexperienced, poorly trained teachers, but the results are more problematic when they are compared to fully prepared and experienced teachers, Heilig and Jez report.

Because of these differences, the question most frequently asked—Are TFA teachers “as good as” teachers who enter the profession through other routes?—is not the question we should be asking, Heilig and Jez contend. Whether one or the other group is better is “a question that cannot be answered unless we first identify which TFA and non-TFA teachers we’re asking about,” they write.

Even more important, “The lack of a statistically and practically significant impact should indicate to policymakers that TFA is likely not providing a meaningful reduction in disparities in educational outcomes, notwithstanding its explosive growth and popularity in the media,” according to Heilig and Jez. Moreover, despite its rapid growth, TFA remains a tiny fraction of the nation’s teaching corps; for every TFA teacher, there are 50,000 other teachers in the U.S., Heilig and Jez note, and the small numbers and small impact of TFA point to a needed “shift in thinking.”

“We should be trying to dramatically improve the quality of teaching,” write Heilig and Jez. “It is time to shift our focus from a program of mixed impact that, even if the benefits actually matched the rhetoric, would not move the needle on America’s educational quality due to the fact that only 0.002% of all teachers in the United States are Teach For America placements.”

The authors conclude with a series of recommendations. For example, they urge policymakers and school districts to invest in “evidence-based educational reforms” and to undertake a detailed understanding of “the peer-reviewed research literature on the impact of new, promising innovations.”

Heilig and Jez also offer recommendations specific to TFA. They urge districts to support TFA staffing “only when the alternative hiring pool consists of uncertified and emergency teachers or substitutes”; to require contractual, five-year commitments from TFA teachers, which would improve student test-score achievement and reduce teacher turnover; to require TFA teachers – indeed, all teachers – to obtain additional training “based on well-supported best practices for in-service teacher professional development”; and to better understand TFA’s fiscal impact by comparing data such as finder fees, placement, and attrition rates for TFA teachers, as well as the program’s various costs, by communities.

Find the report Teach for America: A Return to the Evidence, by Julian Vasquez Heilig and Su Jin Jez, on the web at:
http://nepc.colorado.edu/publication/teach-for-america-return.

The mission of the National Education Policy Center is to produce and disseminate high-quality, peer-reviewed research to inform education policy discussions. We are guided by the belief that the democratic governance of public education is strengthened when policies are based on sound evidence.  For more information on NEPC, please visit http://nepc.colorado.edu/.

Contact: 
William J. Mathis, (802) 383-0058, wmathis@sover.net
Julian Vasquez Heilig, (512) 471-7551, jvh@austin.utexas.edu

URL for this press release: http://tinyurl.com/k745er7

For those of you that would like more information on the specific findings, I have included the Executive Summary from the report below.

Executive Summary

Teach For America (TFA) receives hundreds of millions of public and private dollars and has garnered acclaim for sending college graduates, who do not typically have an education background, to teach in low-income rural and urban schools for a two-year commitment. The number of TFA corps members has grown by about 2,000% since its inception in 1990. The impact of these transitory teachers is hotly debated. Admirers see the program as a way to grow the supply of “outstanding” graduates, albeit temporarily, as teachers. Critics, however, see the program as a diversion from truly beneficial policies or even as a harmful dalliance into the lives of low-income students who most need a highly trained, highly skilled, and stable teacher workforce.

Despite a series of non-peer-reviewed studies funded by TFA and other organizations that purport to show benefits of TFA teachers, peer-reviewed research on their impact continues to produce a mixed picture. The peer-reviewed research suggests that results are affected by the experience and certification level of the TFA teachers as well as by the group of teachers with whom those TFA teachers are compared. The question’s specifics strongly determine the answer.

The practical question faced by most districts is whether TFA teachers do as well as or better than fully credentialed non-TFA teachers with whom those school districts aim to staff their schools. On this question, the predominance of peer-reviewed studies have indicated that, on average, the students of novice TFA teachers perform less well in reading and mathematics assessments than those of fully credentialed beginning teachers. But the differences are small, and the TFA teachers do better if compared with other less-trained and inexperienced teachers. Again, the comparison group matters greatly.

The lack of a statistically and practically significant impact should indicate to policymakers that TFA is likely not providing a meaningful reduction in disparities in educational outcomes, notwithstanding its explosive growth and popularity in the media. The program is best understood as a weak Band-Aid that sometimes provides some benefits but that is recurrently and systematically ripped away and replaced.

Experience has a positive effect for both TFA and non-TFA teachers. Most peer-reviewed studies find that the relatively few TFA teachers who stay long enough to become fully credentialed (typically after two years) appear to do about as well as other similarly experienced, fully credentialed teachers in teaching reading and sometimes do better than this comparison group in teaching mathematics. However, since more than 50% of TFA teachers leave after two years and more than 80% leave after three years, it is impossible to know whether these more positive findings for experienced TFA recruits result from additional training and experience or from attrition of TFA teachers who are less effective.

TFA’s revenue has rapidly expanded. Between 2000 and 2013, TFA’s yearly operating expenditures increased 1,930%—from $10 million to $193.5 million. Of those expenditures, TFA annual reports show that about a third of operating costs are borne by the public. Also, over the past ten years, TFA has obtained nearly a half of a billion dollars from private sources. With an organization as large as TFA, there is no perfect way to assign specific costs, but dividing TFA’s income reported in its 2011 annual report by the number of corps members yields a figure of approximately $25,490 for each corps member recruited and placed. About a third of this money comes from local, state, and federal budgets, earmarked to support TFA as a perceived benefit to society. Another third comes from tax-deductible charitable donations from individuals and corporations to TFA (which is incorporated as a non-profit). And the final third comes from private foundations. Including what TFA spends directly per recruit, our calculations show that the total cost of the two-year commitment from a TFA recruit can easily exceed $70,000 when including professional development, training and other costs.

Due to the high turnover of TFA teachers, the re-occurring costs of hiring 100 TFA recruits is quite high for society—about $6,044,000 more than hiring 100 Non-TFA teachers. From a school and district perspective, TFA is also expensive. Recruiting and training replacements for teachers who constantly churn involves recurring financial costs. Districts also pay TFA a fee per corps member per year employed—resulting in a substantial on-going expenditure.

Thus, despite hundreds of millions of dollars in funding and extensive lobbying by supporters and prominent alumni, TFA appears to offer few if any benefits for improving teacher quality in hard-to-staff schools. Why, then, is there so much discussion, even controversy, surrounding TFA?

Despite persistent claims to the contrary, a simple answer to the question of the overall utility of TFA teachers for urban and rural schools is elusive. The program is sometimes viewed by policymakers and advocates as a way to meaningfully address the very real need for high-quality instruction in hard-to-staff schools—and it is clearly not that. At best, hiring TFA teachers is a stop-gap measure for some desperate schools that is somewhat better than their other poor options. But even in those cases, the program is a diversion away from truly beneficial policies.

Instead of trying to understand whether or not TFA teachers are as good as non-TFA teachers (a question that cannot be answered unless we first identify which TFA and non-TFA teachers we’re asking about), we propose a shift in thinking about the impact of TFA. We should be trying to dramatically improve the quality of teaching. It is time to shift our focus from a program of mixed impact that, even if the benefits actually matched the rhetoric, would not move the needle on America’s educational quality due to the fact that only 0.002% of all teachers in the United States are Teach For America placements. It is therefore recommended that policymakers and districts:

  • Invest strategically in evidence-based educational reform options already incontrovertibly identified in the peer-reviewed research literature as substantially improving student success by larger margins than the mixed evidence on TFA.
  • Devote effort to understanding the peer-reviewed research literature on the impact of new, promising innovations.

Based on the review of the evidence, we make the following recommendations to districts in regards to hiring through TFA:

  • Support TFA staffing only when the alternative hiring pool consists of uncertified and emergency teachers or substitutes.
  • Consider the significant costs of TFA teachers, estimated at over $70,000 per recruit, and press for contractual five-year commitments to improve student test-score achievement and reduce costly teacher turnover.
  • If not already compulsory, require TFA teachers to receive additional teacher training that is based on well-supported best practices for in-service teacher professional development. We recommend this for non-TFA teachers, too, but feel it is especially important for TFA teachers given their limited pre-service training.
  • Independently obtain contracts and data to compare, by community, finder fees, placement and attrition rates of TFA teachers, and various costs.

For all of Cloaking Inequity’s posts on TFA go here.

Please Facebook Like, Tweet, etc below and/or reblog to share this discussion with others.

Want to know about Cloaking Inequity’s freshly pressed conversations about educational policy? Click the “Follow blog by email” button in the upper left hand corner of this page.

Twitter: @ProfessorJVH

Click here for Vitae.

Please blame Siri for any typos.

Interested in a Masters in Educational Policy and Planning from UT-Austin? Go here.

Invited Senate Testimony on Charters

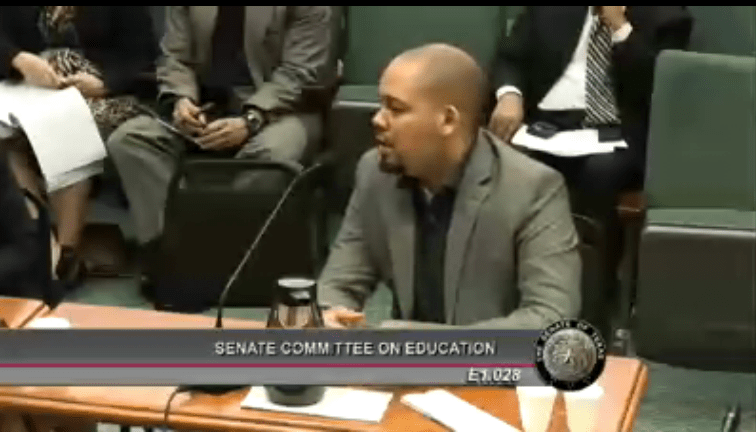
I was invited by Senator Royce West to give testimony on charter schools at the Texas Senate Committee on Education for SB2. You can see the full hearing here. My testimony begins at about 2:29. See Cloaking Inequity’s full thread on charters here.

Here is original text of my testimony:

First I am honored to sit before you today. I appreciate the opportunity to speak ON SB2

Background

I am an Associate Professor of Educational Policy and Planning at UT-Austin.

Worked for Houston ISD in Research and Accountability during the Rod Paige Superintendency.

I then obtained a Phd Educational Policy analysis at Stanford University.

I am

Former charter school instructor in California

Current charter school board member

My daughter attends a charter school

As us professors are apt to do, I would like to speak today on data and theory related to charters and SB2

Instead of offering rhethoric, my role as faculty member at UT-Austin is to address some specific facts from peer-reviewed statistical research.

The data that I will now present is the overall perspective on charters. It of course doesn’t not mean that there are not island of excellence in charters.

Probably the most well known statistical research on charters was conducted by Stanford’s CREDO. They found that 85% of charters across the nation perform no better than traditional public schools.

So here is your UT-Austin stats class quiz question for today:

What is 85% of 200?

Well 170 districts. Thus, if you applied the national research to Texas, with greater accountability from the SBOE and TEA you would have lots of wiggle room under the existing cap.

We do know that there are more low-performing charters in Texas than high-performing.

We do know for Latinos, of the 70 high schools in the state that are majority Latino and majority college ready, only 6 of them are charters. [For African Americans]

We do know, on average, African American leavers (attrition and dropout) are double and sometimes triple in charter schools compared to traditional urban public schools.

We do know charters are heterogeneous and are not created equal. You could think of the charters in Texas as three types— Corporate, Community and Inter-governmental. What is interesting about our most recent statistical analysis in a soon to be released study is that average Texas achievement data show that community-based charters outperform the corporate charters across the state.

Considering that in a recent radio interview Mike Feinburg has said that charters will not “circle the wagons” for low-performing charters and Mr. Torkelson said today that they shouldn’t “see the light of day in the next school year.” Due to the wide range of quality of charter schools, it is an important consideration for whether we should lift the cap or instead trim the fat?…

AND NOW FOR THE THEORY: QUESTIONS ON IMPLICATIONS OF SB2 FOR DEMOCRACTIC CONTROL OF SCHOOLS

What are the implications for democracy of a politically appointed charter authorizing authority? What the implication of injecting politics into chartering decisions?

What are the implications of $1 school buildings? Empty schools are a district’s wiggle room, once they are gone, and enrollment growth increases communities will have to fund new buildings. My daughter calls it “stuck like chuck”

Also, how do we deal with schools that the state comes in closes? Why wouldn’t the state be motivated to close schools writ-large because they perceive charter schools as a “savings to the budget” because they derive their funding from many sources other than the state?

In Chicago for example, there are many empty schools because of school closures required by statute [and declining enrollment and mayoral direction]. Potentially by allowing a yet undefined under-utilization assessment to determine which buildings would be transferred for $1 to charters their is the potential to destabilize and deconstruct the flexibility in our public school system.

Also, what are the implications for democracy for 20-year charters that would essentially take local control out of chartering schools for a generation?

Finally, I think it’s important to ask a meta question— a philosophical question. What should parents actually be able to choose?? Are the right options on the table? Or in our endless search for inexpensive educational policy are important options such as hiring teachers that have more than 30 hours or five weeks of summer training off the table? 

A New Way to Do Accountability

How can we banish NCLB’s top-down and narrow paradigm? Here is how you do it…

Accountability should foster collective community goals.

In education, there are many measures of student success from school entry through graduation and beyond.

Here are Community-Based Accountability Executive Summary and Key Features. Please forward and circulate widely. These are living documents and will be revised as feedback and comments occur.

I am giddy, are you ready for a new idea for accountability that emphasizes local control?

I have included the Key Features of Community-Based Accountability below.

Birth of Accountability

  • Texas was one of the earlier states to develop statewide testing systems during the 1980s. The state adopted minimum competency tests for school graduation in 1987.
  • SB 7 mandated the creation of the Texas accountability system and was implemented in 1994— it utilized test scores and other measures of student progress to determine whether school districts should remain accredited by the state. From 1995-1999, Texas test-based accountability expanded to the school level under Governor George W. Bush.
  • President George W. Bush chose Rod Paige as his first Secretary of Education. They enacted No Child Left Behind in 2001.

Has Top-Down Accountability Worked?

  • Texas has completed nearly two decades of high-stakes testing and accountability.
  • The report Texas leading its peers and the nation?: A Decadal Analysis of Educational Data reported that over the past decade Texas dropped 21 spots in 4th grade math, four spots in 4th grade reading, and eight spots in 8th grade reading. Texas did improve its standing in 8th grade math, moving from 22nd to 18th.
  • Waivers are occurring because NCLB will not close the achievement gap in the United States by 2014.
  • The current design of testing and accountability has created disillusionment amongst many former supporters of No Child Left Behind.
  • Accountability should foster collective bottom-up local goals, rather than a top-down one-size-fits-all approach.

A New Idea for Educational Policy 

  • CBA involves a process where superintendents, school boards, school staff, parents, students and community stakeholders set short-term and long-term goals based on their local priorities.
  • CBA strategic plan statements developed at the local-level would serve as alternatives to NCLB’s intense focus top-down, one-size-fits-all policy. It would enable local communities to focus on the outcomes that really matter in addition to test scores (i.e. career readiness, college readiness, safety).
  • This new form of accountability would allow for communities to drive a locally based approach that focuses on a set of measures of educational quality for their one-year, five-year, and ten-year goals.
  • State and federal government role would be to calculate baselines, growth, and yearly ratings (Recognized, Low-Performing etc.) for the goals that communities select in a democratic process.

Community-Based Accountability Process

For those invested in educational reform, there is a strong movement toward more community-based involvement. The belief is that by engaging local leaders and resources, schools can be made stronger by leveraging what is locally available and therefore, more meaningful, familiar, and tailored to the wants and needs of the community.

The goal of CBA is a community engagement for the greatest benefits of its citizens. In education there are many measures of student success from school entry through graduation and beyond. In general, the goals of CBA are relatively straightforward: students enter school ready to learn, they achieve proficiency in core subjects, they successfully graduate from high school and pursue some form of postsecondary work or study, they are safe and healthy throughout their school years, they live in stable communities, their families and community members are involved in their success and they are prepared with 21st century skills.

How to achieve these goals is different for each community. To accommodate the development of CBA goals, local communities must be prepared to build and access capacity to engage in a community process in order to create short-term and long-term goals for the community. CBA would likely require a lead agency (school board, non-profit, etc.) convened by local elected officials to fulfill the mandate of the community via a democratic process. This lead agency should be representative of the community and be prepared to implement its direction. The process can include:

  • Those leading the community process have standing in the community and are viewed as representative leaders.
  • Infrastructure will be developed to convene members of the community to engage in educational discussions.
  • Those involved have the ability and knowledge necessary to make decisions on educational issues for the community or engage experts when necessary.
  • There is a commitment to bring in whatever resources are needed to fulfill the community’s direction and goals.
  • Members of the community are engaged in and feel represented by the lead agency and the community process.

  Community-Based Accountability Measures

Career Readiness

An important measure of success is the career readiness of graduates. The business community will likely be involved in the process of determining which types of training are important for schools in their community. Career readiness goals are important as it is probable that the business community will strategically contribute resources needed to reach the goals if they have had some say in the process of developing career readiness goals.

Potential areas of measurement: Associate degrees earned; career and technology licenses or certifications earned; and salary and employment upon completion of career and technology program.

Community Engagement

Members of the community are valuable resource in gauging the success of local schools. Feedback from stakeholders in the community serves as an opportunity for local schools to understand their successes and failures.  Independently conducted local surveys for example, could be utilized to involve the community in evaluating success and failures to ensure that local schools are addressing the needs of both the students and the community they serve.

Potential areas of measurement: Community agency partners; community outreach; community satisfaction surveys; mentorship programs; parental involvement; PTA/SDMC; and social services availability.

Curriculum

Research demonstrates that high performing schools are characterized as environments where students come first, high expectations exist for all learners, and teachers utilize rich instructional activities.  Communities want their students to have a core of knowledge that surpasses memorized facts to include working literacies in mathematics, science, language arts, and social studies.  Creating situational understanding of the strengths and weaknesses in available curriculum offers community members a stake in the goal setting processes of public education accountability.

Potential areas of measurement: Class size; class type (e.g. advanced, regular); citizenship and civics curriculum; college credit hours; course offerings by campus; diverse and exploratory course offerings; dual credit; ESL and bilingual programs; graduation plan; non-campus-based instruction; Pre-K program type; volunteer and community outreach programs.

Educator Quality

Educators are responsible for managing students effectively and efficiently with the goal of high student achievement. Research has shown a correlation in a student’s achievement and the teacher that they were assigned. In addition, poor teacher quality translates to loss of taxpayer’s money when a child’s education is threatened. The high quality teacher measures required by NCLB are woefully inadequate for the public to understand educator quality. Educator quality is often cited in research as the single biggest factor in the success of a student.

Potential areas of measurement for educator quality: Attrition rates; certification (e.g. traditional or alternatively certified); degree level, degreed subject (e.g. online, state, or private); ESL certified/ESL Supplemental/Special Ed Certified/GT Certified; inter and intra district transfers; high-quality optional professional development offered; student success (e.g. grade retention, dropout, discipline, college & career readiness, etc.); National Board Certification; teaching within field (e.g. composite/single subject); and years of service.

Potential areas of measurement for principal quality: Degree level; degreed subject; experience; principal attrition rates; and whole school performance teacher turnover at school.

High-Stakes Testing

The accountability system in Texas has been primarily focused on measuring minimum competency via high-stakes testing. In a similar vein, NCLB focuses AYP on all students meeting proficiency by 2014. The multiple measures approach in CBA will aid local communities by including high-stakes testing results in the accountability formula, but would provide leeway to local communities to choose the assessments that they deem appropriate. Alternative assessments for schools that serve large numbers of special populations also could be a part of the democratic CBA selection process in each community.

Potential areas of measurement: ACT; ITBS; NWEA; PSAT; SAT; Stanford; and STAAR (state-mandated exams).

Higher Education

CBA also would promote longer-term accountability outcomes. Ultimately our society cares whether students are college ready which means that students can thrive in higher education environments. The skills necessary for this success are: Intellectual curiosity, reasoning, problem solving, academic behaviors, work habits, integrity, and information literacy.

Potential areas of measurement: # of college applied to; # of students admitted to higher education; # of student completing first year of higher education; # of student graduating from 2-year and 4-year institutions; types of majors; and graduate school attendance.

School Climate

In order for learning to occur in a school setting it must have a positive school climate and culture. School climate and culture are linked in the research literature to many other indicators of school success, including teacher retention, stronger academic performance, and lower dropout rates.  School climate refers to the subjective experience that an individual, student, or staff has within the school; school culture refers to the shared beliefs of those in the school’s community that drive the actions of that school.

Potential areas of measurement for student: Academic support; discipline (e.g. consistency of rules, clarity of rules, and fairness of rules); helpfulness of school staff; overall satisfaction; safety; school physical environment; student-peer relationships; and teacher-student relationships.

Potential areas of measurement for teachers: Achievement press; collegial leadership; institutional integrity; morale; overall satisfaction; principal behavior; resource support; teacher engagement and teacher commitment; and teacher-student relationship. 

Potential areas of measurement for parents: Academics; empowers parents; informs parents; involves parents; and overall satisfaction.

School Safety and Discipline  

School safety is considered paramount in creating places of opportunity and learning for all children. To maintain such communities student conduct becomes an increasing area on concern. Data is required to change long-held beliefs about “effective” disciplinary action. . To this end it is necessary that districts, on a school to school level, are able to critically look at their disciplinary practices and correlate those practices with the reality of their overall school safety and campus climate.

Potential areas of measurement: # of students suspended in-school (unduplicated); # of students suspended out-of-school (unduplicated); # of students expelled (unduplicated);  # of students referred to alternative placements (DAEP, JJAEP, AEP);  # of in-school suspensions;  # of out of school suspensions;  # of expulsions;  # of referrals to DAEPs;  # of referrals to AEPs;  # of referrals to JJAEPs;  rates of suspension (ISS and OSS); expulsion; referrals to DAEP, JJAEP, and AEP; rates of mandatory referrals; rates of discretionary referrals; level of PBIS implementation; number of referrals and/or tickets administered by school resource officer on campus.

Student Progress

In conjunction with high-stakes testing, student progress measures make up the outcomes considered in the current form of top-down NCLB accountability. CBA is a retro-fit to the current accountability, and also could include student progress measures in along with the multiple measures contained within this document.

Potential areas of measurement: Dropout/leavers; grade retention; type of diploma; and summer school.

Technology

Technology is a powerful tool that impacts almost every aspect of our lives.  Advances in digital technologies have transformed the world around us and have impacted every professional field.  If we are to prepare students for the 21st century, we must ensure that they have access to both a variety of digital technologies and teachers capable of integrating said technologies effectively into their classrooms. CBA can include variables that measure schools’ effective integration of digital technologies for teaching and learning.

Potential areas of measurement: Access to learning technologies for students and teachers (e.g. 1:1 computing initiatives, broadband internet access, creative software, etc.); accessibility of adaptive technologies for students with special needs; adequate personnel resources for supporting technology integration (e.g. learning technologists, information technology support staff); ongoing content-specific professional development for teachers that focuses on pragmatic solutions to technology integration in their context; student and family access to learning technologies after/away from school; role of technology use in class instruction (e.g. student vs. teacher use, consumption vs. production, replication vs. acceleration or transformation of teaching and learning); and technology integration in classes across the curriculum (e.g. language arts, science, math, etc.).

Economic Context Index

Another intriguing possible for CBA would be an economic index by which school and district could be compared— an oranges to oranges mechanism. The index will create a system and provide a means for communities to view the economic context of their schools and district based on economic variables.  Creating an economic perspective and situational understanding of the needs and strengths of a given community, the economic context indicator would provide community members a starting point in the goal setting process of accountability.

Potential areas of measurement: Adult educational attainment; health insurance coverage; households on public assistance; median household income; per pupil funding; families living in poverty; tax capacity; Title I; and unemployment rate.

Summary: Community-Based Accountability

CBA is already gaining traction as the High Performance Coalition created by Texas SB 1557 is seeking to adopt a Community-Based Accountability and Assessment system for its twenty districts. CBA may usher in a turn in local involvement in schools. Local control has been a bedrock principle of public schooling in America since inception of the nation. NCLB sent us in the opposite direction of this traditional notion.

In the US, our communities, our parents, our educators must see themselves as the solution rather than the problem. This return to a traditional locally based schooling approach would foment a multiple measures approach to education outcomes democratically derived on the local level. As a revision to the current system, CBA can still include measures that currently exist in NCLB— including disaggregation by student demographics. However, these measures will be supplemented by the educational outcomes that communities elect also are in the best interest of their children. Texas was the birthplace of NCLB. Can Texas envision itself as the birthplace of Community-Based Accountability?

For more variables within each potential area of measurement, contact Dr. Julian Vasquez Heilig jvh at austin.utexas.edu

Lead Author Co-Authors Expert Reviewers
Dr. Julian Vasquez Heilig Lindsay Butterfield Dr. Sarah Diem
Dr. Priscilla Canales Dr. Sonya Horsford
Becky Cohen Dr. Su Jin Jez
Rep. Philip Cortez Dr. Scott McLeod
Heather Cole Dr. Victor B. Saenz
Katherine Jackson Dr. Richard Reddick
Sylvia Jauregui
Meghan Lehr
Melinda A. Lemke
Dongmei  Li
Allen McMurrey
Lindsay Redd
Gregory RussellBo La SohnStephen Spring
Dr. Ruth VailAmy Williams