
Do you have five minutes to understand whether Teach For America (TFA) is effective? Mathematica does and they did in their latest study of TFA. More on this lead later in the review. The taxpayers of the USA paid Mathematica about $12 million for a couple of studies of TFA. We reviewed the prior 2013 study on “secondary” teachers in two prior posts on Cloaking Inequity: New Mathematica TFA Study is Irrational Exuberance and “Does Not Compute”: Teach For America Mathematica Study is Deceptive? In the Irrational Exuberance post we sought to write a review of the 2013 study that was in language readily accessible to parents, policymakers, educators and others. In the post Deceptive Study, we conducted a more technical review of Mathematica’s 2013 TFA study.
Last week, the newest Mathematica study on TFA was released and focuses only on teachers in prekindergarten through grade 5. So we (Myself and Dr. Francesca Lopez, faculty at the University of Arizona) are again seeking to decipher and discuss their latest study for the general public.
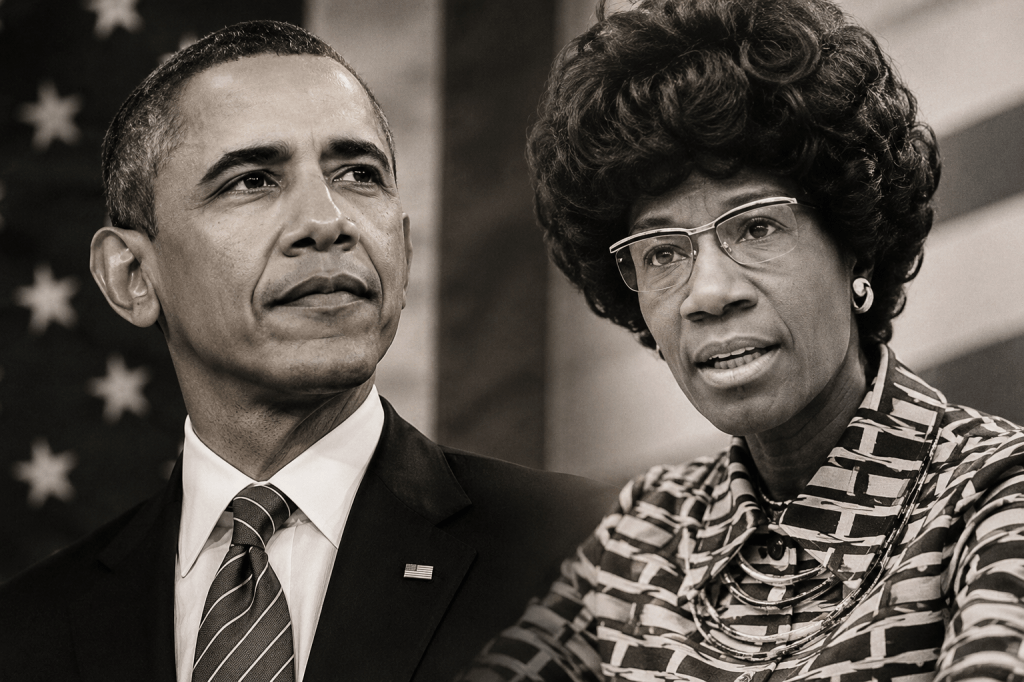
Teach For America, Arne Duncan and the Obama Administration apparently liked the idea that TFA should be expanded dramatically over the past couple of years. To do so, they gave them $50 million in taxpayer dollars in the i3 grant program. From the Mathematica report:
In 2010, TFA launched a major expansion effort, funded in part by a five-year Investing in Innovation (i3) scale-up grant of $50 million from the U.S. Department of Education. Under the i3 scale-up, TFA planned to increase the size of its teacher corps by more than 80 percent by September 2014, with the goal of placing 13,500 first- and second-year corps members in classrooms by the 2014–2015 school year and expanding to 52 regions across the country. While TFA ultimately fell short of the growth goals set in its scale-up application (Mead et al. 2015), by the 2012–2013 school year, the second year of the scale-up, it had expanded its placements by 25 percent, from 8,217 to 10,251 first- and second-year corps members.
About 1/3 of TFA operating funds come from taxpayers sources. For example, they have a $12 million appropriation in Texas that was off limits even when the state cut $5.4 billion from education a few years ago. The new Republican governor has promised to give TFA millions more in Texas.
So is TFA taxpayer money well spent?
Let’s start with Mathematica’s three main “findings”:
- First- and second-year Teach For America (TFA) corps members recruited and trained during the Investing in Innovation scale-up were as effective as other teachers in the same high-poverty schools in teaching both reading and math.
- TFA teachers in lower elementary grades (prekindergarten through grade 2) had a positive, statistically significant effect on students’ reading achievement of 0.12 standard deviations, or about 1.3 additional months of learning for the average student in these grades nationwide.
- We did not find statistically significant impacts for other subgroups of TFA teachers that we examined.
Finding 1: TFA Teachers did NOT statistically improve achievement relative to comparison teachers
Let’s being with the first “finding.” The infamous “as effective” graph was first sent to me on Twitter by one of my former UT-Austin stats students the day the study was released— he noticed the spin right away.
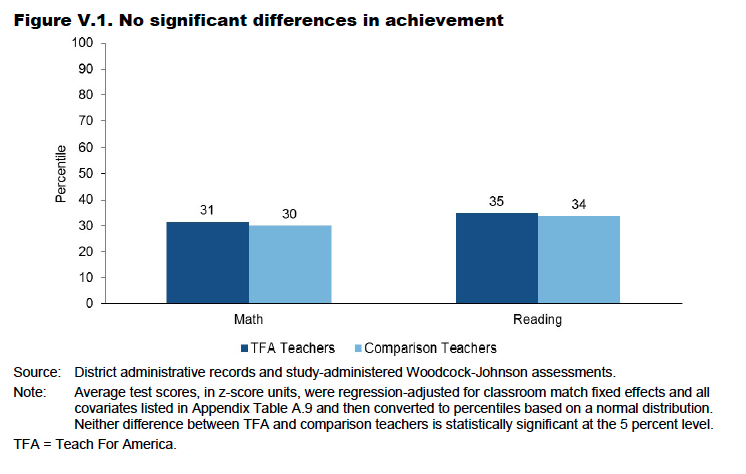
Mathematica knows better than to spin this graph, but they did anyway. In the introductory statistics course that I teach, we of course talk about the difference between the “eye ball test” and results that are statistically significant. The eye ball test is what the average person does when they look at a bar graph produced by a study and say “one bar is higher than the other” so, therefore, TFA is slight better. This is false. What statistical significance tells you is that you can be at least 95% confident that the difference is not solely due to chance in the sample. This is important because if a result is not statistically significant, you could resample and the results in bar graphs could be flipped to the opposite or even. In other words, if a graph is not statistically significant, then there is nothing to see here that we should be confident about. But Mathematica chose to spin this graph as “they perform about the same.” They know better— the result is not statistically significant.
Finding 2: I have five minutes kid, tell me what you know
So about that five minutes. The one place that Mathematica said that TFA teachers did ok was in prekindergarten through grade 2. However, they used five minutes, YES, five minutes to figure that out.
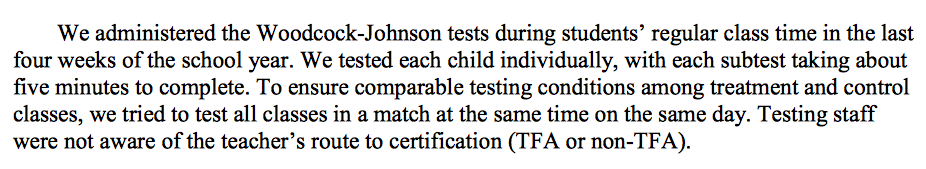
Mathematica states,
We found that for both math and reading, TFA teachers were equally as effective as traditionally certified comparison teachers (including both novices and veterans).
Equally effective at what?…Mathematica utilized performance on the Woodcock Johnson III for the Pre-K-2 results— which takes 5 minutes to administer. Thus, the effectiveness of TFA teachers compared to Pre-K – 2nd grade teachers is based on a five minute administration to capture letter-word identification (Pre-K – 2) and applied problems for mathematics Pre-K – 2). Furthermore, one of the more egregious issues in the study is the aggregation of grades is that of the states that have Pre-K programs, more than half of states do not even require Pre-K teachers to have a bachelor’s degree. The report does not state that lack of a degree was an exclusion criteria and it is explicit that community preschools were included, so it appears than an aggregate that includes not only alternatively certified but also non-degreed teachers worked to TFA’s advantage. Should we really be impressed that TFA teachers outperformed a group that could have included non-degreed teachers? And they do it twice: with kindergarten and with grades K, 1, and 2.
Finding 3: Subgroups of TFA DID NOT improve achievement
Even with the limitations in the methodology and sample that we discuss above and below, they reported “We did not find statistically significant impacts for other subgroups of TFA teachers that we examined.” Enough said.
Do the teachers in the study represent TFA’s mission and reality?
Interestingly, the sample in the newest TFA study is very similar to the last Mathematica study— they chose to study primarily White TFA teachers. This time 70% of the TFA sample was White. In the last Mathematica study, if I remember correctly, the sample was about 80% White. This is interesting because Teach For America has been talking incessantly about how they are recruiting Black and Latino teachers and that it should be recognized. Why does Mathematica continue to study primarily White TFA teachers and compare them primarily to non-White teachers in the comparison sample when the national narrative around TFA is that they are focused on recruiting Black and Latino teachers? Answer unknown.
We also know that 1/3 of all TFA teachers teach in Charter schools. However, the Mathematica sample is not reflective of that Teach For America reality. Only 1 charter school was included the sample (7%) of the sample.
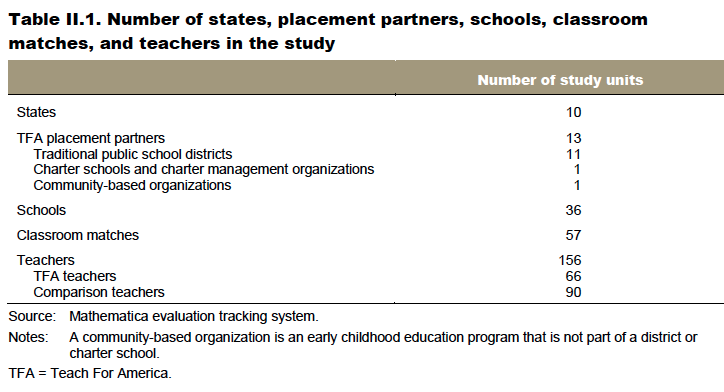
Thus, I find it a bit odd that Mathematica continues to use samples that are not reflective of the organization’s stated mission or realities but argue that their study has validity.
So let’s move to some other interesting findings that address common arguments that you hear from TFA justifying their approach.
Are TFA teachers happy with their experience in TFA?
TFA spends heavily on marketing by producing videos and other promotional materials that show teachers loving their experience in the organization. They also invite policymakers and other to visit the classrooms of TFA teachers and spend hundreds of thousands of dollars lobbying heavily in legislatures. Are those shining and smiling faces actually outliers?
It is difficult to study TFA because as an organization they have infamously required that researchers sign agreements that their work won’t be critical of the organization if they want access to their teachers. So the Mathematica study is unique because TFA has provided them access to TFA teachers and asked them about their satisfaction with the Corps. What does the study reveal about Corps members opinions about the program once they are in? From Mathematica study:
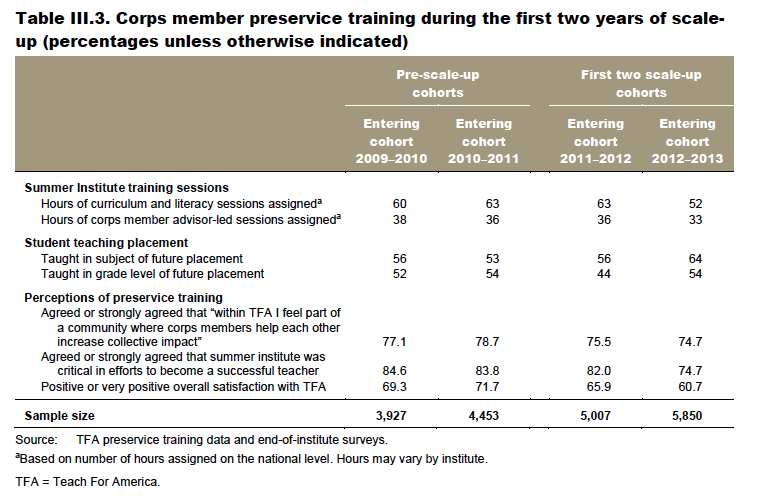
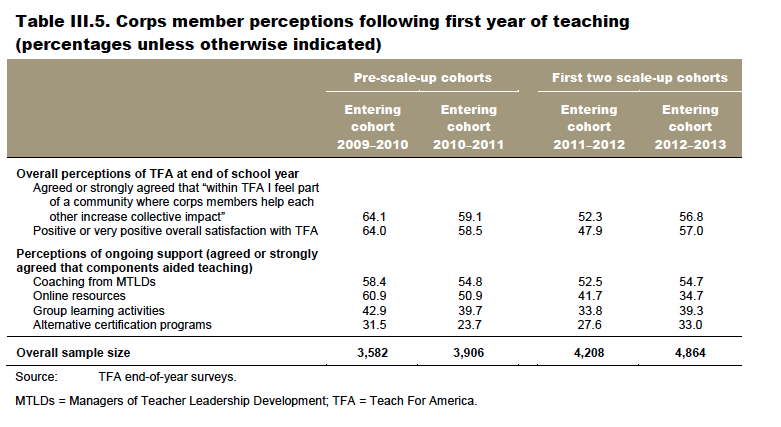
However, we did see some declines in corps members’ satisfaction with the program. For instance, the percentage of corps members who felt that the summer institute was critical for being an effective teacher fell from 85 to 75 percent from 2009–2010 (two years before the i3 scale-up) to the scale-up’s second year, and the percentage reporting either positive or very positive overall satisfaction with the program declined from 64 to 57 percent over this period.
 Apparently, Corps members opinions of TFA are declining. This is a notable development that has not been publicly discussed because the satisfaction data was not made available previously to the public.
Usefulness and Quality of TFA training declining?
So what do TFA teachers think of the “training” that they receive from the organization and elsewhere? The Mathematica study found that TFA Corps members perceptions of the quality of training received is declining. Only 52% currently believe that their TFA provided coaching aided their teaching— 50% online resources, 40% group learning, and 24% for alternative certification programs. Considering that 60% of all new teachers in Texas are Alternatively Certified, that 24% number is VERY troubling. Are you listening legislators?
Now let’s review the characteristics of TFA teachers reported in the Mathematica study.
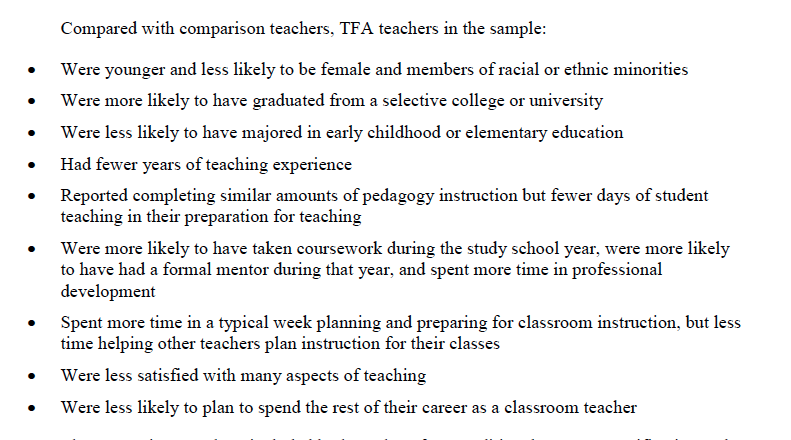
So the teachers were— on average— young, White, and from a selective colleges. They had not studied early childhood in college and had very little teaching experience. They reported a similar amount of “pedagogy” (primarily the 60 hours from the five week Summer Institute), and more professional development (as we discussed above, they viewed it not very valuable). TFA teachers also reported less student teaching experience before they entered the classroom. They also were more likely to be working with a formal mentor (I mentioned David Greene’s point about the drain on mentors due to the constant carousel of Teach For America teachers in and out of schools here). As new teachers, they spent more time planning their own lessons, but were less likely to to help other teachers. Finally, TFA teachers were less satisfied “with many aspect of teaching” and less likely to “plan to spend the rest of the career as a classroom teacher.”
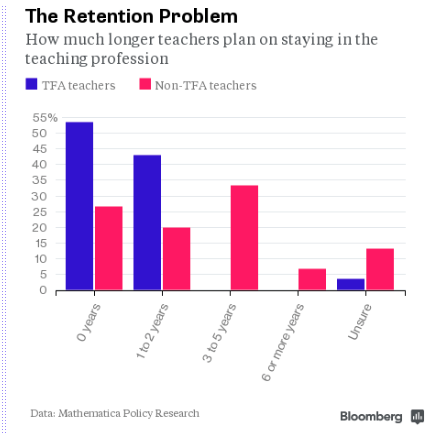
Bloomberg picked up on the last point in the story Most Teach For America Instructors Plan to Flee Teaching. Akane Otani noted in the article,
More than 87 percent of TFA teachers say they don’t plan on remaining teachers throughout their careers, compared with 26.3 percent of non-TFA teachers working in the same subjects, grades, and schools.
Wow. One of my thoughts in the Otani article was,
Because teachers typically become much more effective starting in their third, fourth, and fifth years, according to Vasquez Heilig, it’s possible many of TFA’s inexperienced hires never reach their prime as teachers. “TFA should focus not on creating reformers who’ve only been in the classroom for two years before they run for a school board or go to law school, but think about creating teachers who are there for the long term”
Even the National Review weighed in on the study,
What happens to student test scores when super-high-achieving college graduates spend a couple of years teaching in low-income schools? Well, not a whole lot, according to a new random-assignment study from the policy-research group Mathematica.
The outlier? Time Magazine who said Teach for America Passes a Big Test Maybe they didn’t read and/or understand the study. Although, it’s understandable that Time got it wrong because of this.
In conclusion, read at face value, here is the message Mathematica appears to promulgate with the report:
- We do not need experienced (read: more expensive) teachers when non-experienced, less expensive teachers get the “same” —though not statistically significant— outcomes.
- We do not need a more diverse workforce of teachers, again, because TFA teachers, who are overwhelmingly white, get the same outcomes.
Is TFA really in alignment with a vision for providing every student a high quality teacher? Or do they, Mathematica et al. just keep telling us that they are?

See also two NEPC policy briefs examining all of the peer review research on the organization Teach For America: A review of the evidence and Teach For America: A Return to the Evidence (The Sequel)
For all of Cloaking Inequity’s posts on Teach For America click here.
Want to know about Cloaking Inequity’s freshly pressed conversations about educational policy? Click the “Follow blog by email” button in the upper left hand corner of this page.
Please blame the media who continue to write only puff pieces for/about TFA for any typos.
Twitter: @ProfessorJVH
Click here for Vitae.


Leave a comment