
Has the flood of lies about education reform reached a crescendo 10 years post Katrina? The news media (and President Obama) has mostly spun a narrative of “improvement” and “real progress” post Katrina. However, there are several notable stories out this week that are providing counternarrative. I will begin with a look at the national and national comparative data for Louisiana and the RSD in my new policy brief that I collated primarily from Louisiana voices and was released by the the Network for Public Education. I will then conclude with a roundup of the lessons learned from the aforementioned counternarrative.
In 2003, the Louisiana legislature created the Recovery School District (RSD). With this law, schools that did not meet “minimum academic standards” were to be taken over by the state.[ii]
Then came Hurricane Katrina.
Striking the coast on August 29, 2005, Katrina destroyed not only New Orleans, but also much of the Mississippi Gulf Coast. Soon after, in November 2005, the Louisiana legislature passed Act 35.[iii] The new law lowered the academic criteria that made a school eligible for takeover and empowered the state to takeover 100 plus “low performing” schools. The RSD was given the vast majority of New Orleans public schools, leaving just a few high-performing schools to be run by the Orleans Parish School Board.[iv]
In 2010, U.S. Secretary of Education and education reformer Arne Duncan infamously referred to Hurricane Katrina as “the best thing to happen to the education system of New Orleans.”[v]Repeatedly, the RSD has been acclaimed as a positive “game changer for New Orleans”[vi] and has been held up as a model for school reform by various education reformers, politicians, foundations, think tanks, and lobbyists in states across the nation. More recently, the education reformers have parlayed a single research study as demonstration of success in the RSD.[vii]
For the 10th anniversary of Katrina, this brief seeks to provide an overview of Louisiana and RSD data ten years after the implementation of widespread “education reform” in New Orleans.
The National Assessment of Educational Progress (NAEP)
The NAEP is the largest nationally representative and continuing assessment of what America’s students know and can do in various subject areas.[viii] This analysis will focus on the 8th grade 2013 NAEP Reading and Math— currently the most recent NAEP data available. For a pre- and post- Katrina comparison, 2003 8th grade NAEP is included.
Bottom US States: 2003 NAEP Math 8th[ix]

In math, Louisiana increased its scale score 7 points, reflecting longer term rising NAEP scores across the nation. However, relative to all states, it remained ranked at 47th in the nation.
Bottom US States: 2003 NAEP Reading 8th[x]

In reading, Louisiana also increased the average NAEP scale score. However, its ranking relative to other states dropped from 46th to 47th in the nation.
Reform in New Orleans has been heavily focused on charter schools. However, to our knowledge a comparison of traditional and public schools in Louisiana has not been conducted using student-level NAEP data. Using HLM statistical techniques, Dr. Francesca Lopez and Dr. Amy Olson used restricted data from the National Assessment of Educational Progress (NAEP) to compare the achievement between charter schools and public schools.[xi] This technique allowed the researchers to compare similar students in similarly demographically situated schools. For the sake of consistency, we have included the 8th grade NAEP Reading and Math analyses in this brief.[xii]
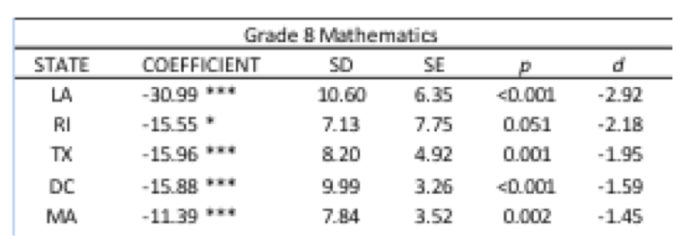
Charter versus Traditional School NAEP comparison
The five states demonstrating the largest gaps on the 2011 NAEP 8th Math between traditional schools and charter schools were Louisiana, Rhode Island, Texas, District of Columbia, and Massachusetts. Lopez and Olson’s statistical models show the largest disparities in the US between traditional and charter schools exist in these five states: traditional public schools significantly outperform charter schools with moderate to large differences (d = 1.45 to 2.92).
Lopez and Olson also calculated the disparity in NAEP 8th Reading scores between traditional and charter schools; Louisiana, District of Columbia, Illinois, Florida, and Massachusetts showed the largest differences with the magnitude of the effects (d) ranging from 1.10 to 2.24.

The data demonstrate that Louisiana had the largest disparity in student achievement between charters and traditional schools in the nation, with charter school students underperforming on average by 2 to 3 standard deviations compared to public school students for both NAEP reading and mathematics.[xiii]
Dropout and Graduation
The RSD graduation rate is last in the state of Louisiana at 61.1% out of 72 school systems.[xiv]The RSD is still the biggest dropout and “push out”[xv] factory in the state, with many low performing students leaving school as early as the 7th and 8th grades.[xvi]
Advanced Placement
Even though many RSD schools tout themselves as college prep in the media and public discourse, only 5.5% of their students who take Advanced Placement courses in the RSD score high enough on the AP tests to get credit. RSD Advanced Placement test results are some of the lowest in the state.[xvii]
ACT Scores
In 2004, Louisiana’s composite ACT score of 19.8 was ranked 48th in the nation. Ten years after Katrina, Louisiana is still ranked 48th in the nation and the composite score dropped to 19.2 for the state.[xviii]
Bottom US states: 2004 ACT Scores[xix]

Bottom US states: 2014 ACT Scores[xx]

The 2014 ACT composite scores for the RSD also do not appear to support the narrative that privately controlled, top-down reforms are working in New Orleans.[xxi] The Class of 2013 ACT composite for RSD was 16.3. A year later, the 2014 ACT composite for all RSD high schools was 15.6. For RSD-New Orleans high schools, it was 15.7.[xxii] Out of 70 Louisiana public school districts listed, the state-run RSD ranked 66th in the state of Louisiana’s 2014 ACT average composite scores.[xxiii] As a result, the majority of students in the RSD don’t qualify to enter 4-year universities in Louisiana.[xxiv]
In summary, the NAEP scores have risen in reading and math, but Louisiana’s ranking relative to the nation has remained the same in math and dropped one spot in reading. The new NAEP research in this brief shows that Louisiana charter schools perform worse than any other statewhen compared to traditional schools. This finding is highly problematic for the conventional narrative of charter success in Louisiana and the RSD. Also, the RSD dropout, push out, and graduation rates are of concern— placing last and nearly last in the state. After ten years of education reform it is a disappointment that only 5% of RSD students score high enough on AP tests to get credit. The review of data also demonstrates that neither the Louisiana ACT nor RSD ACT scores are positive evidence of success.
In conclusion, the national comparative data suggest that there is a dearth of evidence supporting a decade of test-score-driven, state-takeover, charter-conversion model as being implemented in New Orleans. The predominance of the data suggest that the top-down, privately controlled education reforms imposed on New Orleans have failed. The state and RSD place last and nearly last in national and federal data. These results do not deserve accolades.
To download and share a copy of this Policy Brief please click here.

So what are the lessons learned from NOLA? What’s Obama et al. not telling us?
Research on Reforms, August 21, 2015 “10 Years Later: Did the RSD Make It Better? Yes, for Students in Selective Charter Schools” by Barbara Ferguson
While we rejoice for the children and youth who did make it to selective schools, we mourn for those still in a broken system because they were the very ones for whom the reforms were intended.
New York Times—Opinion, August 22, 2015 “The Myth of the New Orleans School Makeover” by Andrea Gabor
For outsiders, the biggest lesson of New Orleans is this: It is wiser to invest in improving existing education systems than to start from scratch. Privatization may improve outcomes for some students, but it has hurt the most disadvantaged pupils.
International Business Times, August 28, 2015 “The Uncounted—Since Hurricane Katrina, an Untold Number of Students May Have Been Left Behind” by Owen Davis
Staffer Darren Aldridge, who was 14 when Katrina struck, bounced through five high schools before dropping out and getting his GED through YEP. He now runs a YEP program that helps students pass high school equivalency tests. Aldridge is ambivalent about the progress since Katrina. “When you see these 16, 17-year-old kids coming to get a GED, what does it mean?” To Aldridge, the answer is clear. “They pushed a lot of kids out of the system.”
Instead of taking schools away from parents and communities, we demand that they be returned to them, and provided the full resources necessary to establish sustainable community schools. Instead of limiting participation in our democracy, we demand that the ability of citizens to use their civic engagement capacity to impact their schools and communities be expanded. If healthy living and learning communities with strong outcomes are the goal, publicly owned and locally controlled, fully funded sustainable community schools will out-pace state takeover districts, hands-down.
Mercedes Schneider’s EduBlog Louisiana Charters Are by Far the Worst According to 2011 8th-grade NAEP Analysis by Dr. Mercedes Schneider
New Orleans charter success is white-privileged-blown smoke and state-controlled mirrors. However, a more realistic, sobering word is surfacing, and the frayed, marketing edges of all-charter, state-run RSD are getting increasingly more obvious to the American public…
In These Times, August 28, 2015 “Ten Years After Katrina, New Orleans’ All-Charter System Has Proven a Failure” by Colleen Kimmett
Many who have seen charters replace traditional public schools report the same problems that New Orleans residents describe: closures of public schools that held neighborhoods together, younger and less experienced teachers, the loss of union jobs, experimental teaching practics that can be rigid or harsh, cherrypicking of students and rapid teacher burn-out.
In an email to In These Times, New York University education professor and NPE founder Diane Ravitch summarized the emerging, less-rosy narrative of the New Orleans model, “That model requires firing all the teachers, no matter their performance, allowing them to reapply for a job, and replacing many of them with inexperienced TFA recruits. That model requires wiping out public schools and replacing them with privately managed schools that set their own standards for admission, discipline, expulsion, and are financially opaque. These heavy-handed tactics require a suspension of democracy that would not be tolerated in a white suburb, but can be done to powerless urban districts where the children are black and Hispanic.”
Is this the education reform crescendo in New Orleans? If so, what will happen after the crescendo?
See also the following Cloaking Inequity posts on education reform in New Orleans:
- “Slave” market education reform in NOLA? #NOLAEdWarning
- Colonizing the Black Natives: Reflections from a former NOLA Charter School Dean of Students
- Al Jazeera includes silenced NOLA ed reform perspectives @AJStream
- LA and the Recovery School District approach (SB1718): A P.T. Barnum Circus
- Who Dat Say?: New Orleans Ed Reform Unmasked
Please Facebook Like, Tweet, etc below and/or reblog to share this discussion with others.
Want to know about Cloaking Inequity’s freshly pressed conversations about educational policy? Click the “Follow blog by email” button in the upper left hand corner of this page.
Twitter: @ProfessorJVH
Click here for Vitae.
CITATIONS
[i] Collated primarily from Louisiana authors. Direct contributions are included in this brief from Jason France, Mike Deshotels, Mercedes Schneider, Francesca Lopez, and Amy Olson.
[ii] https://en.wikipedia.org/wiki/Recovery_School_District
[iii] http://beta.lpb.org/images/lps_uploads/lps201009charter.pdf
[iv]https://s3.amazonaws.com/gnocdc/reports/TheDataCenter_PublicEducation.pdf
[v] http://www.washingtonpost.com/wp-dyn/content/article/2010/01/29/AR2010012903259.html
[vi] https://deutsch29.wordpress.com/2013/03/05/new-orleans-recovery-school-district-the-lie-unveiled/
[vii] http://www.npr.org/sections/ed/2015/08/15/431967706/new-orleans-schools-10-years-after-katrina-beacon-or-warning
[viii] http://nces.ed.gov/nationsreportcard/about/
[ix] http://www.nationsreportcard.gov/reading_math_2013/ – /state-performance
[x] http://www.nationsreportcard.gov/reading_math_2013/ – /state-performance
[xi]The NAEP achievement analyses included all 8th grade students attending public and charter schools in states with a sufficient sample[xi] who took the NAEP reading and/or mathematics assessments in 2011. SPSS version 21.0 was used to manage and clean the data. In order to address the design effects inherent in the complex sampling, we used HLM 7.0 to estimate the two-level models. This version of HLM also permitted us to take the five plausible values of achievement as the dependent variable. Weighting at the student and school level was also applied, given the stratified sampling and to adjust for nonresponse. We estimated a series of 2-level intercepts-as-outcomes models for each subject, grade level, and state. We include Cohen’s d to denote the magnitude of the difference in achievement between charter and public schools.
Dependent Variables
Reading and mathematics achievement (Level 1: NAEP student-level variables)
NAEP relies on item response theory and uses matrix sampling from a total of approximately 150 – 200 items, varying across subjects and grade levels. Each participating student answers only a subset of the achievement items, with the testing portion of the assessment taking about 50 minutes for each subject. NAEP uses marginal maximum likelihood and conditioning techniques to generate 5 plausible values that represent an estimate of the student’s achievement in a particular subject had he or she answered all of the items and not merely a subset.
Level 1: Student Level Control Variables.
Student lunch program status (0-2). We used student’s eligibility for the federal National School Lunch Program as a measure of socioeconomic status (the only one provided by NAEP), coded on a scale of 0 – 2, with 0 = not eligible, 1 = eligible for reduced price lunch, and 2 = eligible for free lunch.
English language learner status (0-1). NAEP includes information about whether a student is currently an EL, formerly an EL, or not an EL. To reduce issues introduced by the variation in the way states determine reclassification of ELs to non-ELs, we included students who were classified as ELs at the time of testing as well as those who had been classified as EL prior to testing (“formerly-EL”), coded as “1.”
Individualized education program (IEP) (0-1). A dummy variable was used to control for whether school records showed that the student was in a special education program as evidenced by the filing of an IEP, where 1 = student had an IEP.
Ethnicity. Dummy variables for students’ ethnicity was included for Latino, African American, Asian, and Native American students with “White” as the excluded category for comparison. Several states did not have a sufficient number of Asian and/or Native American students for the models to run and were subsequently deleted from all models for comparability.
Independent Variables
Charter or Public school (Level 2: NAEP school-level variables)
A dummy variable was included to examine the differences between public schools (coded “0”) and charter schools (coded ‘1”).
Level 2: School Level Control Variables.
Percent racial/ethnic minority (0-100%). We included a measure of percent of enrolled students who are African-American and Latino.
Percent eligible for free/reduced lunch (1-9). We included the percent of enrolled students who are eligible for the federally-funded free or reduced school lunch program. Based on school records, NAEP uses the following categories: 1=0%, 2=1-5%, 3=6-10%, 4=11-25%, 5=26-34%, 6=35-50%, 7=51-75%, 8=76-99%, and 9=100%
[xii] While the restricted student-level NAEP data did not allow for Lopez and Olson to identify specific schools in Louisiana, we do know that approximately 70% of all charters schools in Louisiana are located in New Orleans— and thus probability theory suggests that the sample primarily represents RSD charter schools. http://www.charterschooltools.org/charterSchools.cfm?stateID=18.
[xiii] Lopez and Olson found that Louisiana also leads the nation in the disparity of the proportion of teachers in charter schools who are certified via alternative routes. According to the School and Staffing Survey, almost 66% of teachers in charter schools in Louisiana are alternatively certified compared to 28% of traditional public school teachers. Moreover, Louisiana is ranked among the highest in terms of the proportion of teachers planning to leave the profession and has one of the lowest pay scales in the nation (adjusted for cost of living). In examining teachers’ plans to remain in teaching, all states with reporting criteria met demonstrate a clear pattern: teachers in charter schools are planning to leave teaching as soon as they are able to a higher extent than public school teachers. This pattern was particularly salient in Louisiana, where more than 46% of the teachers in charter schools reported plans to leave compared to only 6% in public schools.
[xiv] http://louisianaeducator.blogspot.com/2015/08/new-rsd-propaganda-machine-whitewashes.html
[xv] http://www.njjn.org/uploads/digital-library/resource_1587.pdf
[xvi] http://researchonreforms.org/html/documents/Tracking9thGradeCohortsFinal.pdf
[xvii] http://louisianaeducator.blogspot.com/2015/08/new-rsd-propaganda-machine-whitewashes.html
[xviii] We don’t include a similar analysis of Louisiana’s SAT scores because only 5% of graduating seniors took the test in 2014.
[xix] http://www.act.org/newsroom/data/2004/states.html
[xx] http://www.act.org/newsroom/data/2014/states.html
[xxi] https://deutsch29.wordpress.com/2015/01/31/louisianas-class-of-2014-act-scores-are-in-this-post/
[xxii] In January-February 2015, Dr. Mercedes Schneider released this ACT information, which she verified firsthand as originating with the ACT information system. She did so because Louisiana State Superintendent John White refused to publicly release the Class of 2014 ACT composites. Within days of Schneider’s initial release of Class of 2014 ACT composites for state-run RSD schools, White released the state’s version of scores— an ACT composite of 16.4 for the RSD Class of 2014.
[xxiii] The four districts scoring lower were much smaller than RSD-New Orleans: Madison: 67 test takers; 15.3 average composite for 2014. St. Helena: 53 test takers; 15.4 average composite for 2014. Tensas: 32 test takers; 15.3 average composite for 2014. City of Baker: 115 test takers; 15.2 average composite for 2014.
[xxiv] http://www.nytimes.com/2015/08/23/opinion/sunday/the-myth-of-the-new-orleans-school-makeover.html?smid=tw-share&_r=0

I just wanted to say thank you.
LikeLike
What is the specific lie that Obama told and in what speech on what date?
LikeLike
Examine the data in this post and determine for yourself whether education reformers’ charter-takeover and top-down approach have made “real progress” in NOLA. Hyperlink to Obama speech is in the first paragraph.
LikeLike
Reblogged this on National Mobilization For Equity.
LikeLike
Link to Dr. Francesca Lopez and Dr. Amy Olson research paper mentioned in brief.
LikeLike
Currently it’s exclusive to this brief but the authors are shopping it to NEPC and open to journal leads.
LikeLike
What is link to Dr. Francesca Lopez and Dr. Amy Olson research you mentioned in brief?
LikeLike
Currently it’s exclusive to this brief but the authors are shopping it to NEPC and open to journal leads.
LikeLike