Ghastly Impact of Closing Schools on Students and Communities

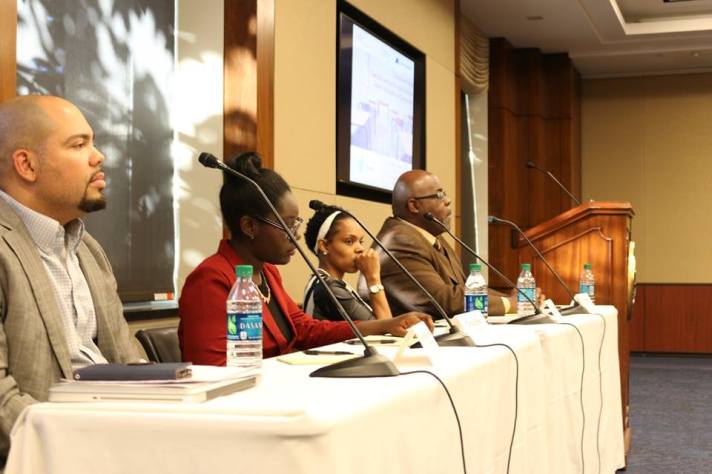
A recent Capitol Hill forum on the impact of school closure held the Rayburn Congressional building demonstrated the ghastly impact of closing schools on students and communities.

The Stanford Center for Opportunity Policy in Education, and the Journey for Justice Alliance, sponsored a breakfast forum entitled “Closed for Learning: The Impact of School Closures” The forum focused on the impact of community school closures in low-income neighborhoods.

The purpose of the forum was to engage Congressional staff and key stakeholders in a discussion on the effects of these school closures on students, parents, and the community at-large. The event featured the perspectives of national advocates, community members, and students.

12341558_1036581649696174_8952056134453294727_n

  • Jon David Snyder, Executive Director, SCOPE
  • Judith Browne-Dianis, Co-Director, Advancement Project
  • Jitu Brown (moderator), National Director, Journey for Justice Alliance
  • Anna Jones, Parent Leader & #FightForDyett Hunger Striker, Kenwood Oakland Community Organization
  • Tanaisa Brown, Newark Student Union
  • Julian Vasquez Heilig, Professor, California State University, Sacramento
  • Linda Darling-Hammond (moderator), Faculty Director, SCOPE
  • Julia Daniel, Doctoral Student Researcher, University of Colorado, Boulder
  • Judith Browne-Dianis, Co-Director, Advancement Project
  • Keron Blair, Director, The Alliance to Reclaim Our Schools

We explored how Congress and federal agencies can promote alternatives to school closings that will improve student learning and support students, educators, and families in communities across the country.

My remarks focused on reviewing school closure evidence. You can watch the presentation on YouTube here:

Massive school closure is a relatively new educational policy approach. In May 2013, the Chicago Board of Education voted to close 47 elementary schools—at the time, it was the largest number of schools closed in one year by any district in the nation.

School closure has become a highly contentious issue in our society. School boards— often politically appointed and sometimes elected— have recently focused on a variety of top-down policies such as school closure.

School-closed-426x188.jpgWe have even come to the point where discussions have occurred that would essentially close entire districts and turn them over to top-down, private control— similar to New Orleans. Dallas and more recently Los Angeles have considered this option.

Proponents of school closure argue that students should receive relief from low-performing schools. But it is still an open question whether school closure does what its proponents purport it to do.

I’d like to walk you through some of the more prominent research and data on school closure. I will discuss research from some of the most well-known school closure locales: New Orleans, Chicago, New York and Michigan. I will also briefly talk about research from lesser discussed school closure in Ohio and North Carolina.

I’ll begin with the minority of research that purports that there are SOME benefits of school closure.

A Journal of Public Economics study focusing only on test scores in Michigan found that achievement of displaced students improved if the closed school is low-performing. However, the study also found that students in receiving schools “suffered” academically due to the influx of students.

A Fordham Foundation study examining Ohio school closures found that test scores marginally increased for students after their schools closed. However, the National Education Policy Center’s review of the study noted that that forty percent of students in closed Ohio schools transferred to campuses that were not higher performing. NEPC noted that the Fordham study did not separately report, or apparently control for, the academic performance of students who remained in low performing schools.images

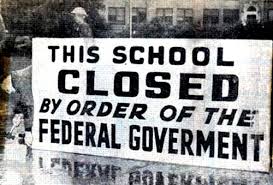
A November 2015 study of New York school closure by the New York Research Alliance found that closures had little impact on the academic outcomes of students who had attend closed schools. However, they still proffered that school closure improved graduation rates for students who would have theoretically attended the closed schools. Clearly there are too many factors to consider that could explain an increase in graduation rates for students who never even attended the closed schools.

Now for the bad news.

Research out of North Carolina showed that school closure impacts students negatively during the closure year. A study conducted by State Board of Education found that students displaced by closure experienced negative effects in the announcement year. Additionally, while 76% of student technically went to schools that were “higher” performing— only 14 percent of students transitioned to a school with a performance composite above 60 percent passing.

New Orleans and Chicago are probably THE most infamous locales where school closure has occurred en masse.

Chicago_montageFirst I’ll discuss Chicago. The problematic outcomes of school closure are readily apparent in the data from Chicago and has been fairly consistently bad news over time. For example, the Chicagoland Researchers and Advocates for Transformative Education (CReATE) found that school closures have historically had a negative impact on children’s academic performance. Analyses of school closures in Chicago reveal that 94% of students from closed CPS schools did not go on to “academically strong” new schools. School closures have not historically resulted in the savings predicted by school officials. Closure-related costs have consistently been underestimated or understated by officials. School closures have exacerbated racial inequalities and segregation in Chicago. Approximately 90% of the school closings have impacted predominately African American communities according to CReATE’s data.

Then there is Louisiana. The locale where top-down education reformers pressed for widespread school closures after Katrina.

Have school closures spurred an education miracle 10 years after the storm?

In a recent policy brief that I authored and was released by the Network for Public Education (See the post Education reform crescendo at #Katrina10), I collected publicly available data from state and federal sources. These data show that Louisiana and the RSD are last in nearly last in nearly all educational outcomes. More than 10 years after school closure and choice arrived in New Orleans— the results from top-down reform are dismal.

Mercedes Schneider, a Louisiana teacher and blogger reported that in the summer 2013, parents were required to “choose” from almost all D and F schools when they completed the Walton Foundation-funded OneApp open enrollment form. The RSD had no A schools and only a few B schools in 2012-13. (See also the post Colonizing the Black Natives: Reflections from a former NOLA Charter School Dean of Students).

Currently, the RSD still has no A schools and only a handful of B schools.

While the Orleans Parish has mostly A and B schools (some charter, some not), the OPSB is quite small when compared to RSD. Also, many of its schools use selective admissions processes, and some of the preferable schools often had additional application criteria beyond One App as a way of pre-screening applicants.gfmbl01-custom

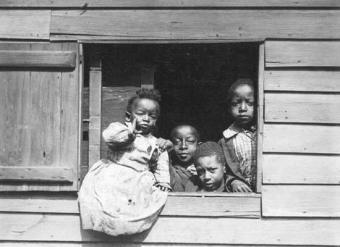
So essentially the New Orleans school closure model has created a market tiering of schools, like wine or ice cream aisle in a grocery store, where you can afford or get access to certain wines but maybe not others because you may not have the capitol to access or purchase the products. In the case of New Orleans, the capital for families and students is transportation, test scores and other admissions requirements.

Essentially school closure has created market segmentation in New Orleans…. where only certain students with various forms of capital can gain access to high-quality schools.

New Orleans parents, such as Karran Royal Harper, have discussed this market tiering extensively— for a decade, parents and students have only been offered mostly-low-graded school options for their children. Only a select few students gain access to the top of the market tier through selective and burdensome application process that many non-low performing schools require.

Mercedes Schneider has written that most NOLA students of color— if they remain in school— and that is a big if considering that the RSD is still last or nearly last in all student outcomes such as dropout and graduation— are essentially just shuffled from low-graded charter school to low-graded charter school.

In conclusion,

Research and data should inform our discussion about school closure. The predominance of the currently available research demonstrates that there is decreased student achievement, increased racial inequality, and parents of color still don’t have access to properly resourced high-quality neighborhood schools.

As a result, it seems clear that the data suggests we consider alternatives to the top-down school closures approach for reforming schools. There is scant evidence in the research literature that supports top-down school closure policies. I believe this is largely because school closure has been— as Jitu Brown said in his opening— a shell game that does not directly address the needs of students or the communities that they live in.

Therefore, it is incumbent upon us to think about community-based solutions that don’t ignore the needs that students bring to schools and the severe resource inequities that still plague in schools located in communities of color. It is my hope that the re-authorization of ESEA that will be signed today will provide momentum for a slate of community-based, democratically controlled approaches to education reform. I look forward to hearing more about community schools as one of the community-based alternatives to the recent decade of top-down reform in the next panel.

Also check out some of Cloaking Inequity’s previous posts about school closure.

Please Facebook Like, Tweet, etc below and/or reblog to share this discussion with others.

Want to know about Cloaking Inequity’s freshly pressed conversations about educational policy? Click the “Follow blog by email” button on the home page.

Twitter: @ProfessorJVH

Click here for Vitae.

Dude, Really?: Education policy kudos and criticism (in the same week)

At my core, the reason why I chose educational policy as a profession is because I care about children.

Today I’d like to take up some of the critics of the policy brief that I included in the post Flood of Lies: Education reform crescendo at #Katrina10 Then I would like to humbly share some very cool kudos that happened this week. Be warned, this post has a certain randomness to it, kind of like my favorite blog MGoBlog.

First let me start with some background. I have never lived in New Orleans, however, I did live in Houston— which is about a five hour drive from NOLA at the speed that I drive. So I have been to New Orleans about ten times in my life. Half of the trips to New Orleans were related to schools and communities.

Recently I spent almost a week in New Orleans meeting with stakeholders and others. I also attended a community-based education reform conference. I was interested in understanding the perspectives parents, students and activists about education reform in the city. They relayed that the focus on “improvement” didn’t match up with the reality of Black students and families. One parent put it this way, “Improvement for Whites, not Blacks.” Recent surveys have supported the predominance of that perspective.

The Wall Street Journal reported,

Looking across the results of surveys conducted in 2006, 2008, 2010, and 2015, a trend is striking: the widening gulf between blacks and whites when it comes to residents’ sense of opportunities for younger people in the city, something our surveys began tracking in 2008.

Honestly I was incensed after the bus tour that Karen Harper Royal took me on that i described in the post “Slave” market education reform in NOLA? #NOLAEdWarning. When you hear and see the perspectives of Black residents of the city, you are surprised by the lack of the representation of their counternarrative about education reform in the media and from other sources (nationally and locally).

Screen Shot 2015-09-01 at 4.11.33 PM
NOLA Brief authored for the Network For Public Education

I didn’t want to be a colonial researcher, by that I mean someone who goes in and takes then leaves. I also didn’t want to be an outsider projecting my perspectives on a community where I have never lived. In fact, these are two common critiques of “education reform” in NOLA that were discussed at the community-based reform conference. (See also Colonizing the Black Natives: Reflections from a former NOLA Charter School Dean of Students)

So, first I decided to take a look at readily available public data from Louisiana and the Recovery School District (NAEP, ACT, Dropout, etc). I was troubled. So, I organized a conference call with four parents and a teacher from New Orleans to discuss the data I was seeing. They were not surprised. It was at that point that thought it would be important to collate a brief based primarily on the perspectives of Louisiana residents. A brief that my mother and sister could read. Not the typical unintelligible academic piece.

They liked the idea. So I then asked them to send me resources that they felt should be included in a policy brief.

As can be expected, there are critiques of the brief. So I’d like to address a few of those here. Briefly, and with a little humor.

Click here for the NPE NOLA policy brief.

1. What about Doug Harris’ single study? (mentioned in footnote 6) No matter how you slice it, the study uses state tests and compares the lowest performing district to schools in one of the lowest performing states. So that is comparing bad to worse. Bad did slightly better than worse. I think the more telling last and nearly last ranking of Louisiana and the RSD in the data are located in the NPE brief (NAEP, Dropout, Pushout, Graduation, ACT etc.)

2. You mentioned CREDO before on Cloaking Inequity. How about CREDO’s study on New Orleans? First, I should say I was converted by NEPC on CREDO’s charter studies.

I think it’s actually okay to change your mind based on new evidence.

Second, I am concerned about the internal validity of the studies based on the fact that apparently CREDO excluded 15% of the data in Louisiana.

3. So “New Orleans is NOT one of the districts that participates in NAEP’s Trial Urban District Assessment” Even if New Orleans participated in the NAEP TUDA, it would be not be valuable because data from charter schools is conveniently (or inconveniently) excluded by the federal government.

unnamed

Why am I talking about the NAEP TUDA anyways? Because one critic briefly liked the idea. That data wasn’t used in the charter vs. traditional school comparisons or pre- and post- Katrina tables because the analysis was of Louisiana as a state. The point being made is that 46 states perform better than Louisiana. That’s fact. It was fact before Katrina, it’s fact now. That’s the data. So about the NAEP sample for the traditional schools versus charter schools in Louisiana. NCES says they sample of be representative:

…charter schools are selected along with other public schools, as part of the sample for each state. Charter schools are therefore sampled to be representative within each state. However, since they are only proportionately sampled, in some states there may not be enough schools and students in sample for them to be reportable, and this could vary over time. 2003 is the only assessment for which a special effort was made to add additional charter schools in some states so that the results would be reportable. However, there are now many more charter schools in most states than there were in 2003, so that the sample sizes of charter schools have grown naturally over time.

So, in the Louisiana sample, charters were sampled by NCES to be representative. A critic of the brief has argued for a series of cross-sectional analyses…but the samples have changed over the years and would invite just as much criticism (Thank you Dr. Francesca Lopez for this point).

4. Does this brief prove causality? I did a search for the following words in the NPE NOLA education reform brief (click on photo of it above to see it): cause (0). causality (0). relationship (0). sidetrack (0). etc. This brief is a collation of data from Louisiana and RSD. Folks can draw their own conclusion on causality, but the conclusion that Louisiana and the RSD are last and nearly last in all of the data discussed is FACT (regardless of year). It is also fact that a decade of test-score-driven, state-takeover, charter-conversion model has occurred over the past ten years in NOLA. No, we did not conduct a randomized experiment or a regression discontinuity etc. However, to the average non-snarky person, the Louisiana and RSD last and nearly last position in the (NAEP, ACT, Graduation, Dropout, Pushout) data speaks for itself.

5. I would loved to have conducted a project like Doug Harris’ study. But, something to be understood is that Doug Harris is politically connected and was given special access by the state of Louisiana to the data for the past several years. He was hand picked to receive the data. In 2013, here is what I wrote in the post LA and the Recovery School District approach (SB1718): A P.T. Barnum Circus

Here is what is interesting about Louisiana that many people don’t know. They are desperately trying to control who accesses public information (data) to examine their “educational miracle.” I have been holding on to this story since 2012 because we have made friendly attempts to gain access to Louisiana data for 10 months. In fact, we have made requests to Louisiana on seven separate occassions since August 2012. When this did not yield data, we made a public information request for an existing dataset already given to CREDO. Louisiana is required by law to respond to public records requests within 3 days, its been more than 90 days and Louisiana has not responded.

ONLY CREDO and Doug Harris received the student-level data from the state of Louisiana. Until this happened in March of 2015: Appeals Court Reverses District Court: Department of Education Must Release CREDO Data to Research on Reforms So now research conducted with student-level by those NOT HANDPICKED by Louisiana politicians and “reformers” is going to start trickling out. Including some that I am participating in currently. More on the peer-reviewed NOLA research soon.

So up until now, the Dude Really? was a surly reference to the critiques of the NPE NOLA brief. But, now I want to segue into a surprised Dude Really? I just want to stay that I was honored by the recognition on two fronts recently. First being named one of the top ten education policy voices (tied for 9th) on social media in the US by Harvard’s Education Next— and the #2 ranked professor behind Dr. Diane Ravitch. I have to be honest, I am not a fan of the publication. They acknowledge as much by calling me an education reform “critic”— a badge of honor in my mind.

Secondly, I was asked to appear on the cover of Diversity in Education magazine October 2015 issue. I think my grandmother will be pleased. I am hoping for a call from GQ or Travel and Leisure (because I need a vacation).

I work the hours that I do for children. Thank you for reading Cloaking Inequity. See you soon.

Please Facebook Like, Tweet, etc below and/or reblog to share this discussion with others.

Want to know about Cloaking Inequity’s freshly pressed conversations about educational policy? Click the “Follow blog by email” button in the upper left hand corner of this page.

Flood of Lies: Education reform crescendo at #Katrina10

Has the flood of lies about education reform reached a crescendo 10 years post Katrina? The news media (and President Obama) has mostly spun a narrative of “improvement” and “real progress” post Katrina. However, there are several notable stories out this week that are providing counternarrative. I will begin with a look at the national and national comparative data for Louisiana and the RSD in my new policy brief that I collated primarily from Louisiana voices and was released by the the Network for Public Education. I will then conclude with a roundup of the lessons learned from the aforementioned counternarrative.

In 2003, the Louisiana legislature created the Recovery School District (RSD). With this law, schools that did not meet “minimum academic standards” were to be taken over by the state.[ii]

Then came Hurricane Katrina.

Striking the coast on August 29, 2005, Katrina destroyed not only New Orleans, but also much of the Mississippi Gulf Coast. Soon after, in November 2005, the Louisiana legislature passed Act 35.[iii] The new law lowered the academic criteria that made a school eligible for takeover and empowered the state to takeover 100 plus “low performing” schools. The RSD was given the vast majority of New Orleans public schools, leaving just a few high-performing schools to be run by the Orleans Parish School Board.[iv]

In 2010, U.S. Secretary of Education and education reformer Arne Duncan infamously referred to Hurricane Katrina as “the best thing to happen to the education system of New Orleans.”[v]Repeatedly, the RSD has been acclaimed as a positive “game changer for New Orleans”[vi] and has been held up as a model for school reform by various education reformers, politicians, foundations, think tanks, and lobbyists in states across the nation. More recently, the education reformers have parlayed a single research study as demonstration of success in the RSD.[vii]

For the 10th anniversary of Katrina, this brief seeks to provide an overview of Louisiana and RSD data ten years after the implementation of widespread “education reform” in New Orleans.

The National Assessment of Educational Progress (NAEP)

The NAEP is the largest nationally representative and continuing assessment of what America’s students know and can do in various subject areas.[viii] This analysis will focus on the 8th grade 2013 NAEP Reading and Math— currently the most recent NAEP data available. For a pre- and post- Katrina comparison, 2003 8th grade NAEP is included.

Bottom US States: 2003 NAEP Math 8th[ix]

Screen Shot 2015-08-29 at 1.40.42 AM

In math, Louisiana increased its scale score 7 points, reflecting longer term rising NAEP scores across the nation. However, relative to all states, it remained ranked at 47th in the nation.

Bottom US States: 2003 NAEP Reading 8th[x]

Screen Shot 2015-08-29 at 1.41.41 AM

In reading, Louisiana also increased the average NAEP scale score. However, its ranking relative to other states dropped from 46th to 47th in the nation.

Reform in New Orleans has been heavily focused on charter schools. However, to our knowledge a comparison of traditional and public schools in Louisiana has not been conducted using student-level NAEP data. Using HLM statistical techniques, Dr. Francesca Lopez and Dr. Amy Olson used restricted data from the National Assessment of Educational Progress (NAEP) to compare the achievement between charter schools and public schools.[xi] This technique allowed the researchers to compare similar students in similarly demographically situated schools. For the sake of consistency, we have included the 8th grade NAEP Reading and Math analyses in this brief.[xii]

Charter versus Traditional School NAEP comparison

The five states demonstrating the largest gaps on the 2011 NAEP 8th Math between traditional schools and charter schools were Louisiana, Rhode Island, Texas, District of Columbia, and Massachusetts. Lopez and Olson’s statistical models show the largest disparities in the US between traditional and charter schools exist in these five states: traditional public schools significantly outperform charter schools with moderate to large differences (d = 1.45 to 2.92).

grade 8

Lopez and Olson also calculated the disparity in NAEP 8th Reading scores between traditional and charter schools; Louisiana, District of Columbia, Illinois, Florida, and Massachusetts showed the largest differences with the magnitude of the effects (d) ranging from 1.10 to 2.24.

grade 8 reading

The data demonstrate that Louisiana had the largest disparity in student achievement between charters and traditional schools in the nation, with charter school students underperforming on average by 2 to 3 standard deviations compared to public school students for both NAEP reading and mathematics.[xiii]

Dropout and Graduation

The RSD graduation rate is last in the state of Louisiana at 61.1% out of 72 school systems.[xiv]The RSD is still the biggest dropout and “push out”[xv] factory in the state, with many low performing students leaving school as early as the 7th and 8th grades.[xvi]

Advanced Placement

Even though many RSD schools tout themselves as college prep in the media and public discourse, only 5.5% of their students who take Advanced Placement courses in the RSD score high enough on the AP tests to get credit. RSD Advanced Placement test results are some of the lowest in the state.[xvii]

ACT Scores

In 2004, Louisiana’s composite ACT score of 19.8 was ranked 48th in the nation. Ten years after Katrina, Louisiana is still ranked 48th in the nation and the composite score dropped to 19.2 for the state.[xviii]

Bottom US states: 2004 ACT Scores[xix]

Screen Shot 2015-08-29 at 1.45.10 AM

Bottom US states: 2014 ACT Scores[xx]

Screen Shot 2015-08-29 at 1.45.45 AM

The 2014 ACT composite scores for the RSD also do not appear to support the narrative that privately controlled, top-down reforms are working in New Orleans.[xxi] The Class of 2013 ACT composite for RSD was 16.3. A year later, the 2014 ACT composite for all RSD high schools was 15.6. For RSD-New Orleans high schools, it was 15.7.[xxii] Out of 70 Louisiana public school districts listed, the state-run RSD ranked 66th in the state of Louisiana’s 2014 ACT average composite scores.[xxiii] As a result, the majority of students in the RSD don’t qualify to enter 4-year universities in Louisiana.[xxiv]

In summary, the NAEP scores have risen in reading and math, but Louisiana’s ranking relative to the nation has remained the same in math and dropped one spot in reading. The new NAEP research in this brief shows that Louisiana charter schools perform worse than any other statewhen compared to traditional schools. This finding is highly problematic for the conventional narrative of charter success in Louisiana and the RSD. Also, the RSD dropout, push out, and graduation rates are of concern— placing last and nearly last in the state. After ten years of education reform it is a disappointment that only 5% of RSD students score high enough on AP tests to get credit. The review of data also demonstrates that neither the Louisiana ACT nor RSD ACT scores are positive evidence of success.

In conclusion, the national comparative data suggest that there is a dearth of evidence supporting a decade of test-score-driven, state-takeover, charter-conversion model as being implemented in New Orleans. The predominance of the data suggest that the top-down, privately controlled education reforms imposed on New Orleans have failed. The state and RSD place last and nearly last in national and federal data. These results do not deserve accolades.

To download and share a copy of this Policy Brief please click here.

Julian's Katrina Infographic

So what are the lessons learned from NOLA? What’s Obama et al. not telling us?

Research on Reforms, August 21, 2015 10 Years Later: Did the RSD Make It Better? Yes, for Students in Selective Charter Schools” by Barbara Ferguson

While we rejoice for the children and youth who did make it to selective schools, we mourn for those still in a broken system because they were the very ones for whom the reforms were intended.

New York Times—Opinion, August 22, 2015 The Myth of the New Orleans School Makeover” by Andrea Gabor

For outsiders, the biggest lesson of New Orleans is this: It is wiser to invest in improving existing education systems than to start from scratch. Privatization may improve outcomes for some students, but it has hurt the most disadvantaged pupils.

International Business Times, August 28, 2015 The Uncounted—Since Hurricane Katrina, an Untold Number of Students May Have Been Left Behindby Owen Davis

Staffer Darren Aldridge, who was 14 when Katrina struck, bounced through five high schools before dropping out and getting his GED through YEP. He now runs a YEP program that helps students pass high school equivalency tests. Aldridge is ambivalent about the progress since Katrina. “When you see these 16, 17-year-old kids coming to get a GED, what does it mean?” To Aldridge, the answer is clear. “They pushed a lot of kids out of the system.”

Instead of taking schools away from parents and communities, we demand that they be returned to them, and provided the full resources necessary to establish sustainable community schools. Instead of limiting participation in our democracy, we demand that the ability of citizens to use their civic engagement capacity to impact their schools and communities be expanded. If healthy living and learning communities with strong outcomes are the goal, publicly owned and locally controlled, fully funded sustainable community schools will out-pace state takeover districts, hands-down.

Mercedes Schneider’s EduBlog Louisiana Charters Are by Far the Worst According to 2011 8th-grade NAEP Analysis by Dr. Mercedes Schneider

New Orleans charter success is white-privileged-blown smoke and state-controlled mirrors. However, a more realistic, sobering word is surfacing, and the frayed, marketing edges of all-charter, state-run RSD are getting increasingly more obvious to the American public…

In These Times, August 28, 2015 “Ten Years After Katrina, New Orleans’ All-Charter System Has Proven a Failure” by Colleen Kimmett

Many who have seen charters replace traditional public schools report the same problems that New Orleans residents describe: closures of public schools that held neighborhoods together, younger and less experienced teachers, the loss of union jobs, experimental teaching practics that can be rigid or harsh, cherrypicking of students and rapid teacher burn-out.

In an email to In These Times, New York University education professor and NPE founder Diane Ravitch summarized the emerging, less-rosy narrative of the New Orleans model, “That model requires firing all the teachers, no matter their performance, allowing them to reapply for a job, and replacing many of them with inexperienced TFA recruits. That model requires wiping out public schools and replacing them with privately managed schools that set their own standards for admission, discipline, expulsion, and are financially opaque. These heavy-handed tactics require a suspension of democracy that would not be tolerated in a white suburb, but can be done to powerless urban districts where the children are black and Hispanic.”

Is this the education reform crescendo in New Orleans? If so, what will happen after the crescendo?

See also the following Cloaking Inequity posts on education reform in New Orleans:

Please Facebook Like, Tweet, etc below and/or reblog to share this discussion with others.

Want to know about Cloaking Inequity’s freshly pressed conversations about educational policy? Click the “Follow blog by email” button in the upper left hand corner of this page.

Twitter: @ProfessorJVH

Click here for Vitae.


CITATIONS

[i] Collated primarily from Louisiana authors. Direct contributions are included in this brief from Jason France, Mike Deshotels, Mercedes Schneider, Francesca Lopez, and Amy Olson.

[ii] https://en.wikipedia.org/wiki/Recovery_School_District

[iii] http://beta.lpb.org/images/lps_uploads/lps201009charter.pdf

[iv]https://s3.amazonaws.com/gnocdc/reports/TheDataCenter_PublicEducation.pdf

[v] http://www.washingtonpost.com/wp-dyn/content/article/2010/01/29/AR2010012903259.html

[vi] https://deutsch29.wordpress.com/2013/03/05/new-orleans-recovery-school-district-the-lie-unveiled/

[vii] http://www.npr.org/sections/ed/2015/08/15/431967706/new-orleans-schools-10-years-after-katrina-beacon-or-warning

[viii] http://nces.ed.gov/nationsreportcard/about/

[ix] http://www.nationsreportcard.gov/reading_math_2013/ – /state-performance

[x] http://www.nationsreportcard.gov/reading_math_2013/ – /state-performance

[xi]The NAEP achievement analyses included all 8th grade students attending public and charter schools in states with a sufficient sample[xi] who took the NAEP reading and/or mathematics assessments in 2011. SPSS version 21.0 was used to manage and clean the data. In order to address the design effects inherent in the complex sampling, we used HLM 7.0 to estimate the two-level models. This version of HLM also permitted us to take the five plausible values of achievement as the dependent variable. Weighting at the student and school level was also applied, given the stratified sampling and to adjust for nonresponse. We estimated a series of 2-level intercepts-as-outcomes models for each subject, grade level, and state. We include Cohen’s to denote the magnitude of the difference in achievement between charter and public schools.

Dependent Variables

Reading and mathematics achievement (Level 1: NAEP student-level variables) 

NAEP relies on item response theory and uses matrix sampling from a total of approximately 150 – 200 items, varying across subjects and grade levels. Each participating student answers only a subset of the achievement items, with the testing portion of the assessment taking about 50 minutes for each subject. NAEP uses marginal maximum likelihood and conditioning techniques to generate 5 plausible values that represent an estimate of the student’s achievement in a particular subject had he or she answered all of the items and not merely a subset.

Level 1: Student Level Control Variables. 

Student lunch program status (0-2). We used student’s eligibility for the federal National School Lunch Program as a measure of socioeconomic status (the only one provided by NAEP), coded on a scale of 0 – 2, with 0 = not eligible, 1 = eligible for reduced price lunch, and 2 = eligible for free lunch.

English language learner status (0-1). NAEP includes information about whether a student is currently an EL, formerly an EL, or not an EL. To reduce issues introduced by the variation in the way states determine reclassification of ELs to non-ELs, we included students who were classified as ELs at the time of testing as well as those who had been classified as EL prior to testing (“formerly-EL”), coded as “1.”

Individualized education program (IEP) (0-1). A dummy variable was used to control for whether school records showed that the student was in a special education program as evidenced by the filing of an IEP, where 1 = student had an IEP.

Ethnicity. Dummy variables for students’ ethnicity was included for Latino, African American, Asian, and Native American students with “White” as the excluded category for comparison. Several states did not have a sufficient number of Asian and/or Native American students for the models to run and were subsequently deleted from all models for comparability.

Independent Variables

Charter or Public school (Level 2: NAEP school-level variables) 

A dummy variable was included to examine the differences between public schools (coded “0”) and charter schools (coded ‘1”).

Level 2: School Level Control Variables.

Percent racial/ethnic minority (0-100%). We included a measure of percent of enrolled students who are African-American and Latino.

Percent eligible for free/reduced lunch (1-9). We included the percent of enrolled students who are eligible for the federally-funded free or reduced school lunch program. Based on school records, NAEP uses the following categories: 1=0%, 2=1-5%, 3=6-10%, 4=11-25%, 5=26-34%, 6=35-50%, 7=51-75%, 8=76-99%, and 9=100%

[xii] While the restricted student-level NAEP data did not allow for Lopez and Olson to identify specific schools in Louisiana, we do know that approximately 70% of all charters schools in Louisiana are located in New Orleans— and thus probability theory suggests that the sample primarily represents RSD charter schools. http://www.charterschooltools.org/charterSchools.cfm?stateID=18.

[xiii] Lopez and Olson found that Louisiana also leads the nation in the disparity of the proportion of teachers in charter schools who are certified via alternative routes. According to the School and Staffing Survey, almost 66% of teachers in charter schools in Louisiana are alternatively certified compared to 28% of traditional public school teachers. Moreover, Louisiana is ranked among the highest in terms of the proportion of teachers planning to leave the profession and has one of the lowest pay scales in the nation (adjusted for cost of living). In examining teachers’ plans to remain in teaching, all states with reporting criteria met demonstrate a clear pattern: teachers in charter schools are planning to leave teaching as soon as they are able to a higher extent than public school teachers. This pattern was particularly salient in Louisiana, where more than 46% of the teachers in charter schools reported plans to leave compared to only 6% in public schools.

[xiv] http://louisianaeducator.blogspot.com/2015/08/new-rsd-propaganda-machine-whitewashes.html

[xv] http://www.njjn.org/uploads/digital-library/resource_1587.pdf

[xvi] http://researchonreforms.org/html/documents/Tracking9thGradeCohortsFinal.pdf

[xvii] http://louisianaeducator.blogspot.com/2015/08/new-rsd-propaganda-machine-whitewashes.html

[xviii] We don’t include a similar analysis of Louisiana’s SAT scores because only 5% of graduating seniors took the test in 2014.

[xix] http://www.act.org/newsroom/data/2004/states.html

[xx] http://www.act.org/newsroom/data/2014/states.html

[xxi] https://deutsch29.wordpress.com/2015/01/31/louisianas-class-of-2014-act-scores-are-in-this-post/

[xxii] In January-February 2015, Dr. Mercedes Schneider released this ACT information, which she verified firsthand as originating with the ACT information system. She did so because Louisiana State Superintendent John White refused to publicly release the Class of 2014 ACT composites. Within days of Schneider’s initial release of Class of 2014 ACT composites for state-run RSD schools, White released the state’s version of scores— an ACT composite of 16.4 for the RSD Class of 2014.

[xxiii] The four districts scoring lower were much smaller than RSD-New Orleans: Madison: 67 test takers; 15.3 average composite for 2014. St. Helena: 53 test takers; 15.4 average composite for 2014. Tensas: 32 test takers; 15.3 average composite for 2014. City of Baker: 115 test takers; 15.2 average composite for 2014.

[xxiv] http://www.nytimes.com/2015/08/23/opinion/sunday/the-myth-of-the-new-orleans-school-makeover.html?smid=tw-share&_r=0

“Slave” market education reform in NOLA? #NOLAEdWarning

On August 29, 2005, Hurricane Katrina struck New Orleans and communities across the Gulf Coast. The destruction and displacement that followed the storm created what some considered a window of opportunity for sweeping changes in New Orleans’ public education system. The state-run Recovery School District assumed control of the vast majority of public schools in Orleans Parish and turned their operation over to charter school management organizations, with the autonomy to recruit new teachers and educational leaders. Veteran teachers in New Orleans were fired en masse. Neighborhood public schools were closed and “choice” among privately managed charter schools defined the new landscape. In 2014-2015, New Orleans became the nation’s first all-charter school district and cities across the nation have begun to adopt the “New Orleans model” of urban school reform.”Kristen-Buras-300x300-300x300

The purpose of the Ten-Year Community-Centered New Orleans Education Research Conference was to prompt a national conversation among prominent urban education researchers and community members most intimately affected by such reform to illuminate effects on the ground. Does research evidence and experiential knowledge suggest the New Orleans model is a guide for cities nationally? Or do the effects on poor and working-class communities of color suggest an alternative policy future for urban public schools? Given ongoing concerns over racial and economic injustice, retrenchment of civil rights, and educational inequity, the ten-year anniversary of Hurricane Katrina presents an ideal, even catalytic, moment to reflect on the progress of recent policy initiatives. Gathering scholars and community-based stakeholders from cities nationwide, this conference will enable careful and collective consideration of the evidence in charting the educational future of our children and the realization of freedom dreams that have inspired previous generations. Kristen Buras, Ph.D.

This past week I had the opportunity to gather with education stakeholders from across the nation in New Orleans at Ten-Year Community-Centered New Orleans Education Research Conference.

I attended to chair a panel on Teach For America’s role in New Orleans reform and to discuss educational policy and share research with attendees and to gauge their perspectives on a variety of issues as being experienced in New Orleans.

I have gathered together selected tweets, Facebook posts and Youtube videos etc to Storify and summarize the important perspective shared about a decade of “school reform” in New Orleans. I hope you enjoy. Click here for the Storify. It’s worth the click.

storifyWhat is Storify? It “helps making sense of what people post on social media.” Users curate voices and turn them into stories.

Please Facebook Like, Tweet, etc below and/or reblog to share this discussion with others.

Want to know about Cloaking Inequity’s freshly pressed conversations about educational policy? Click the “Follow blog by email” button in the upper left hand corner of this page.

Twitter: @ProfessorJVH

Click here for Vitae.

A few photos from the French Quarter.

New Orleans Recovery School District (RSD) Proponents Now Offer a Disclaimer

deutsch29: Mercedes Schneider's Blog

Corporate-reform-supporting proponents of the state-run Recovery School District (RSD) in New Orleans are not known for delivering messages of “caution” regarding the success of the now-100-percent charter district.

What they have managed to do is to shape a success narrative by controlling the success message. So, I was surprised to read the following brief in Politico on April 15, 2015, regarding *cautiously* interpreting RSD *success*:

THE NOLA MODEL: PRAISED BUT UNPROVEN: New Orleans post-Katrina has often been held up, with fanfare, as a successful education experiment. “But I don’t want the national media to say that it worked,” said Mickey Landry, executive director of the Choice Foundation. “Because it didn’t 100 percent.” Mayors and governors from Nevada to Tennessee have been quick to replicate the New Orleans model of converting struggling public schools into privately run charters and giving principals unprecedented autonomy to run their own staffs, budgets and curricula…

View original post 1,507 more words